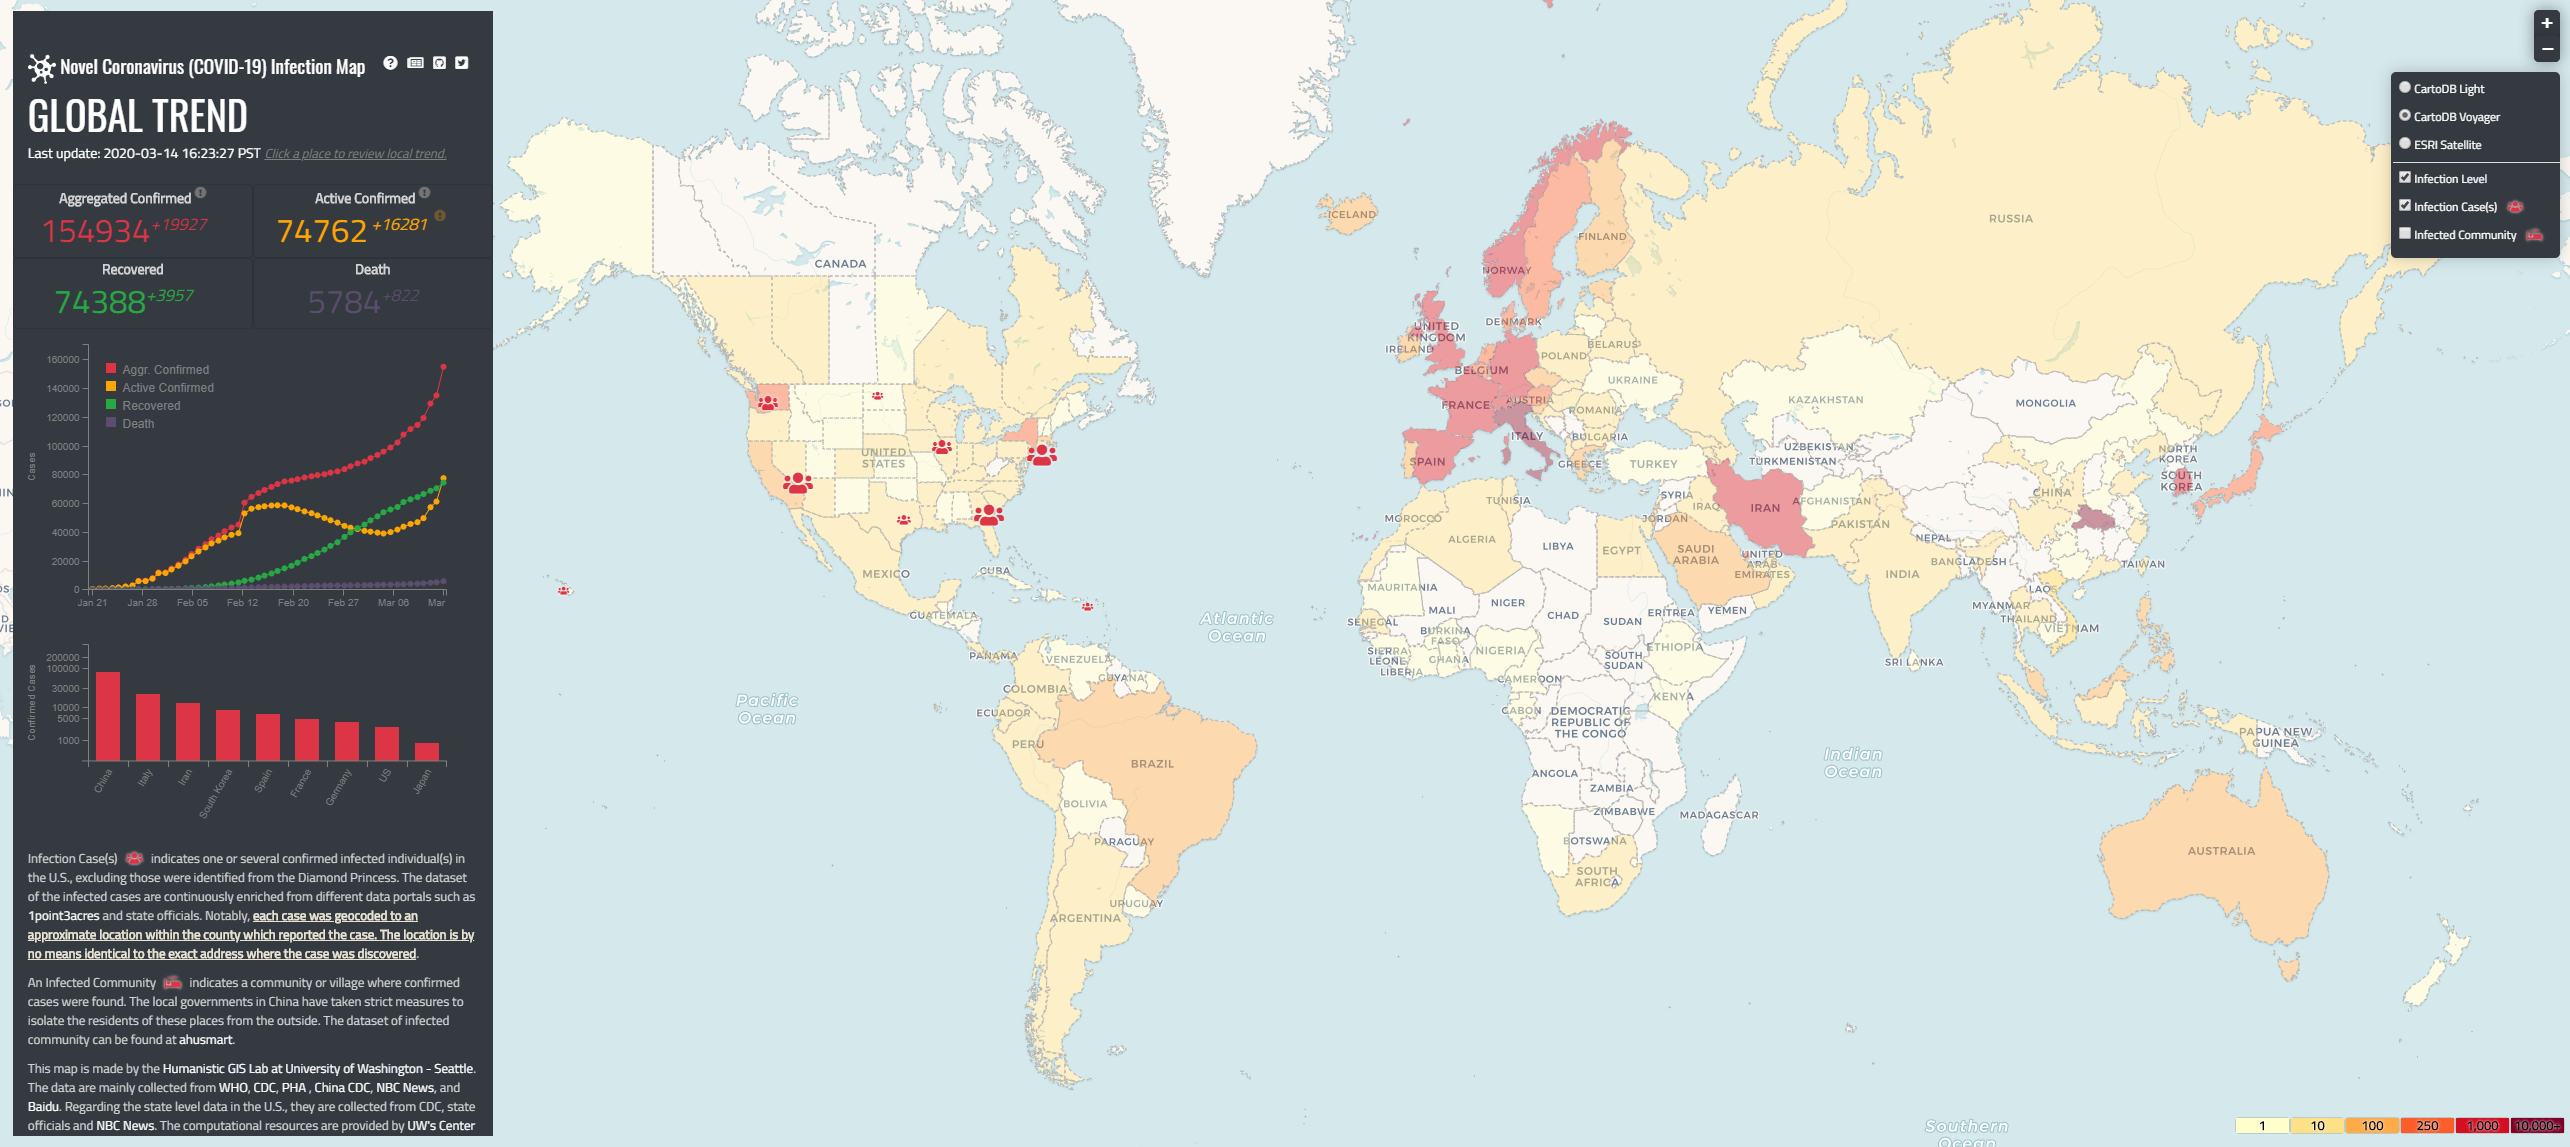
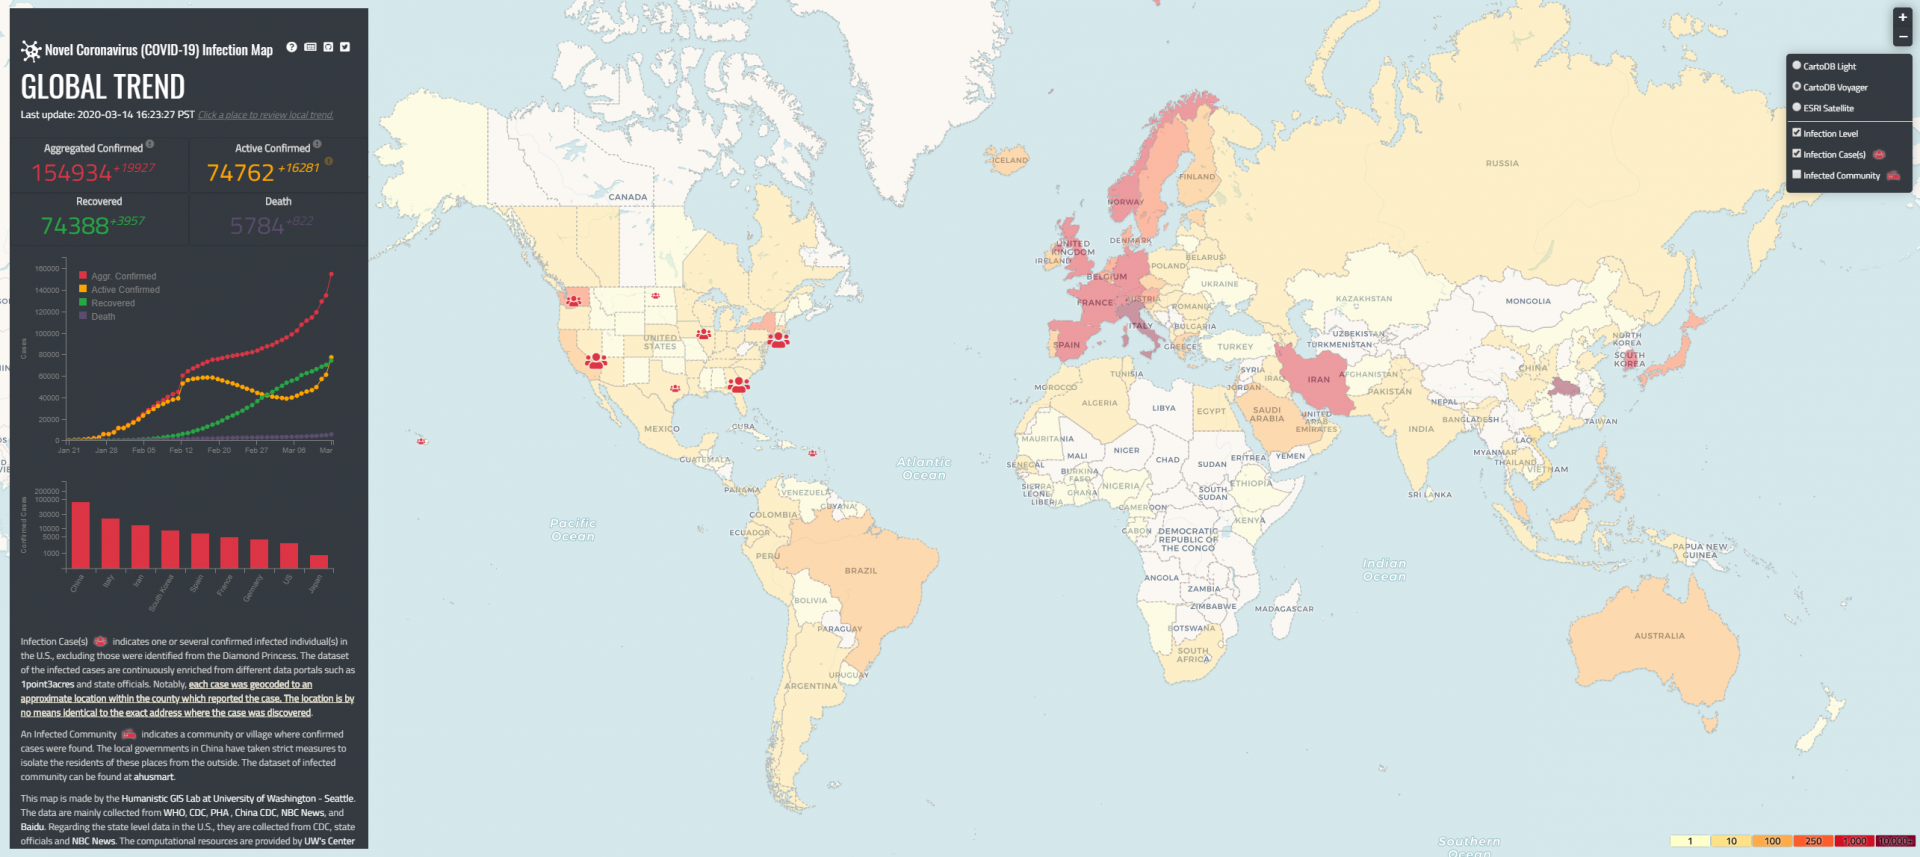
The HGIS lab team is developing a Novel Coronavirus Infection Map. This online interactive map enables users to track both the global and local trends of Novel Coronavirus infection since Jan 21st, 2020. The dataset is timely collected from multiple official sources and then plotted onto the map. Access to the current version of the map is available here.
The source code and more information about this map, including data sources and contributors, can be found here.
This is an ongoing project, and members of the HGIS lab are currently adding updates to the map day by day to improve the functionality. Our website features a choropleth map and a situational heatmap at present to visualize the prevalence and incidence of COVID-19. We welcome any suggestions to make this a better web map for our users.
If you have any questions or concerns, please contact Dr. Bo Zhao via zhaobo@uw.edu for more information.