2026
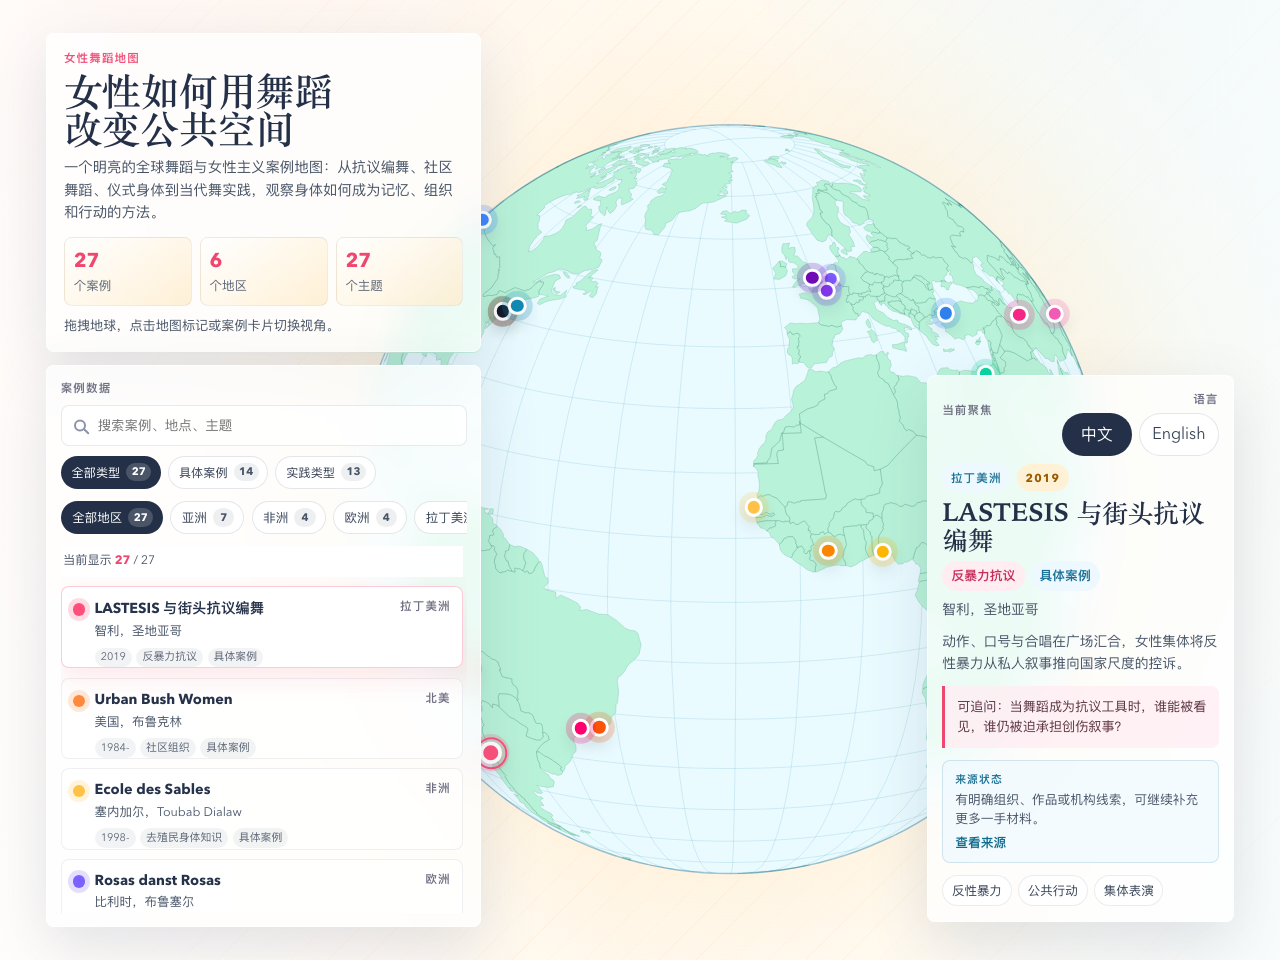
Women's Movement Atlas
A full-screen feminist globe built with D3.js to explore women's dance, protest, ritual, and community movement across the world.
Each project is a working answer to one question: how do we render the meaning of a place? Below are public-scholarship maps, web platforms, and software released by the lab.
2026
A full-screen feminist globe built with D3.js to explore women's dance, protest, ritual, and community movement across the world.
2026
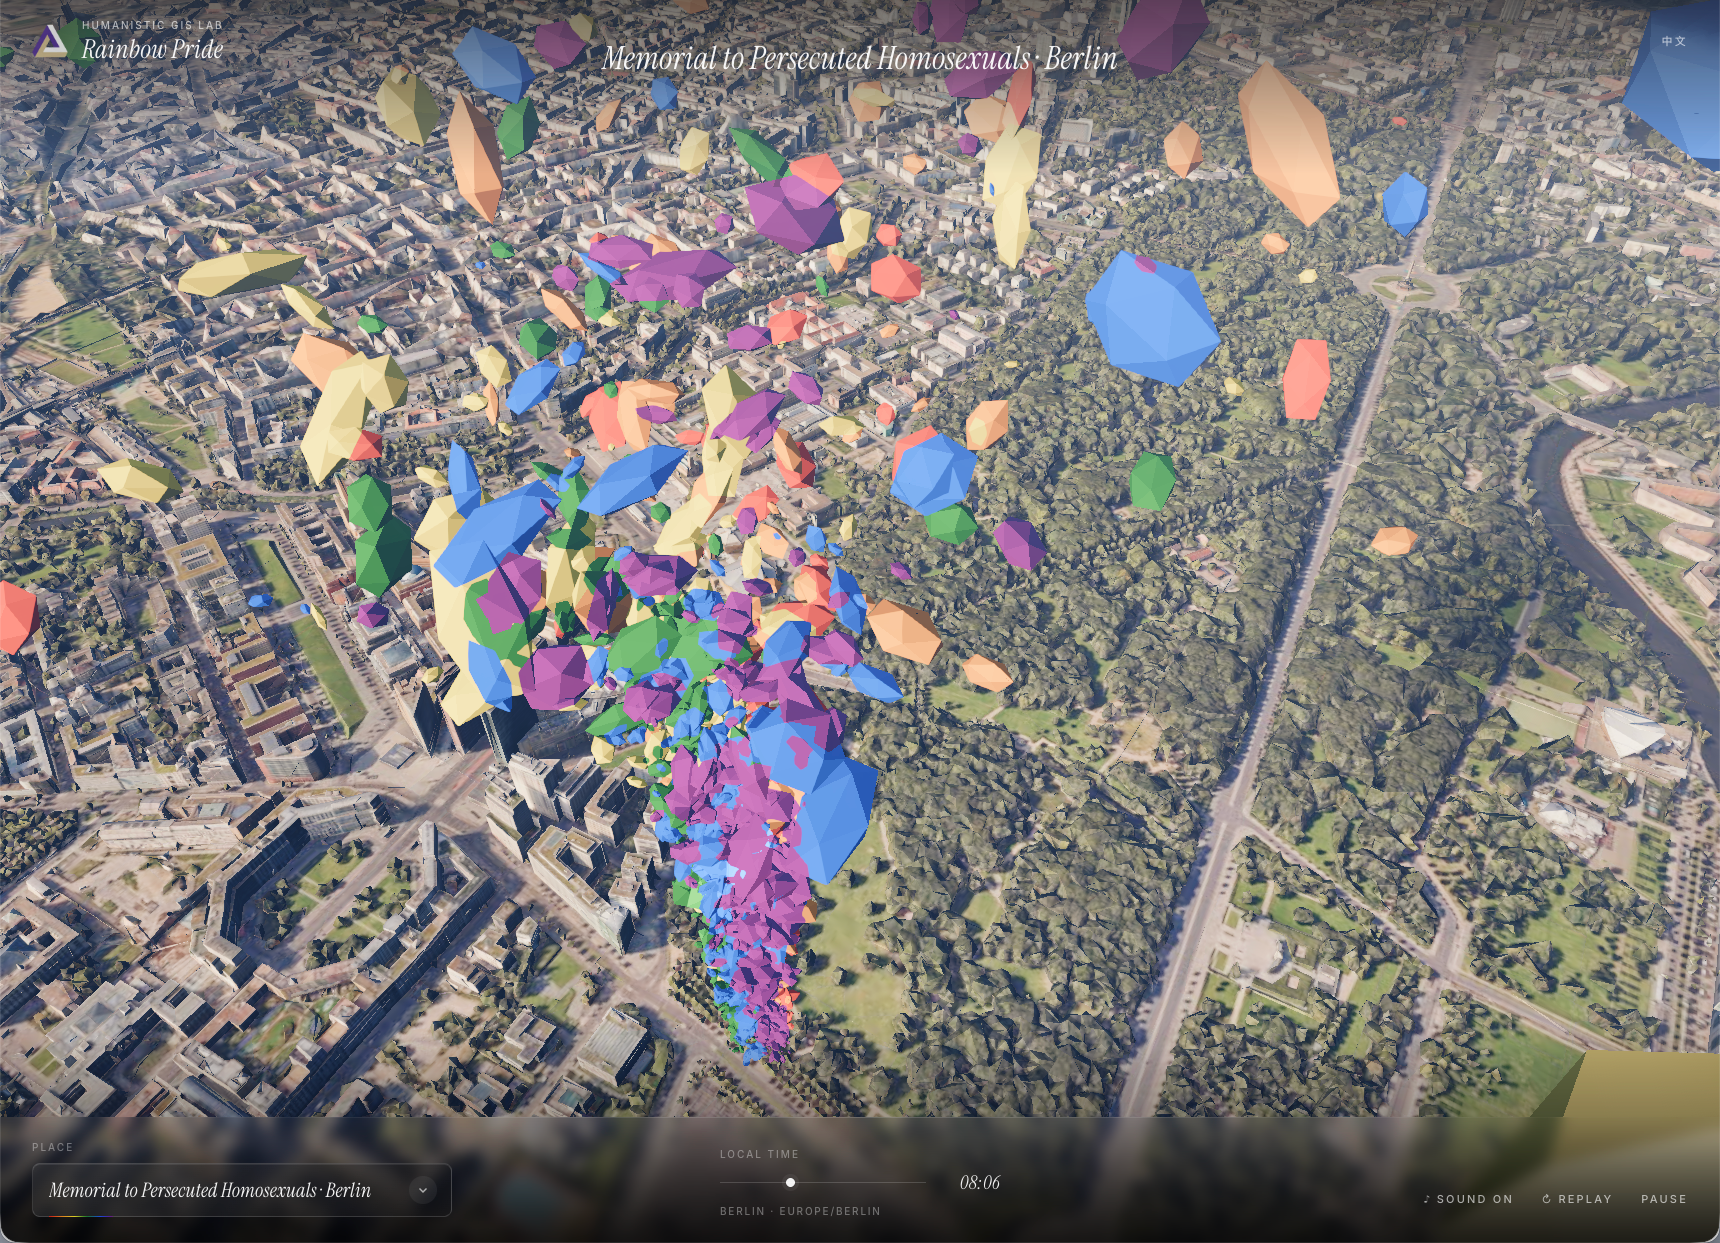
A rainbow field of 3D fragments rises from the UW Quad and other landmarks of queer memory — Stonewall, the Castro, Pulse, Compton's, and beyond — turning each place into a living atmosphere of pride, care, and belonging.
2026
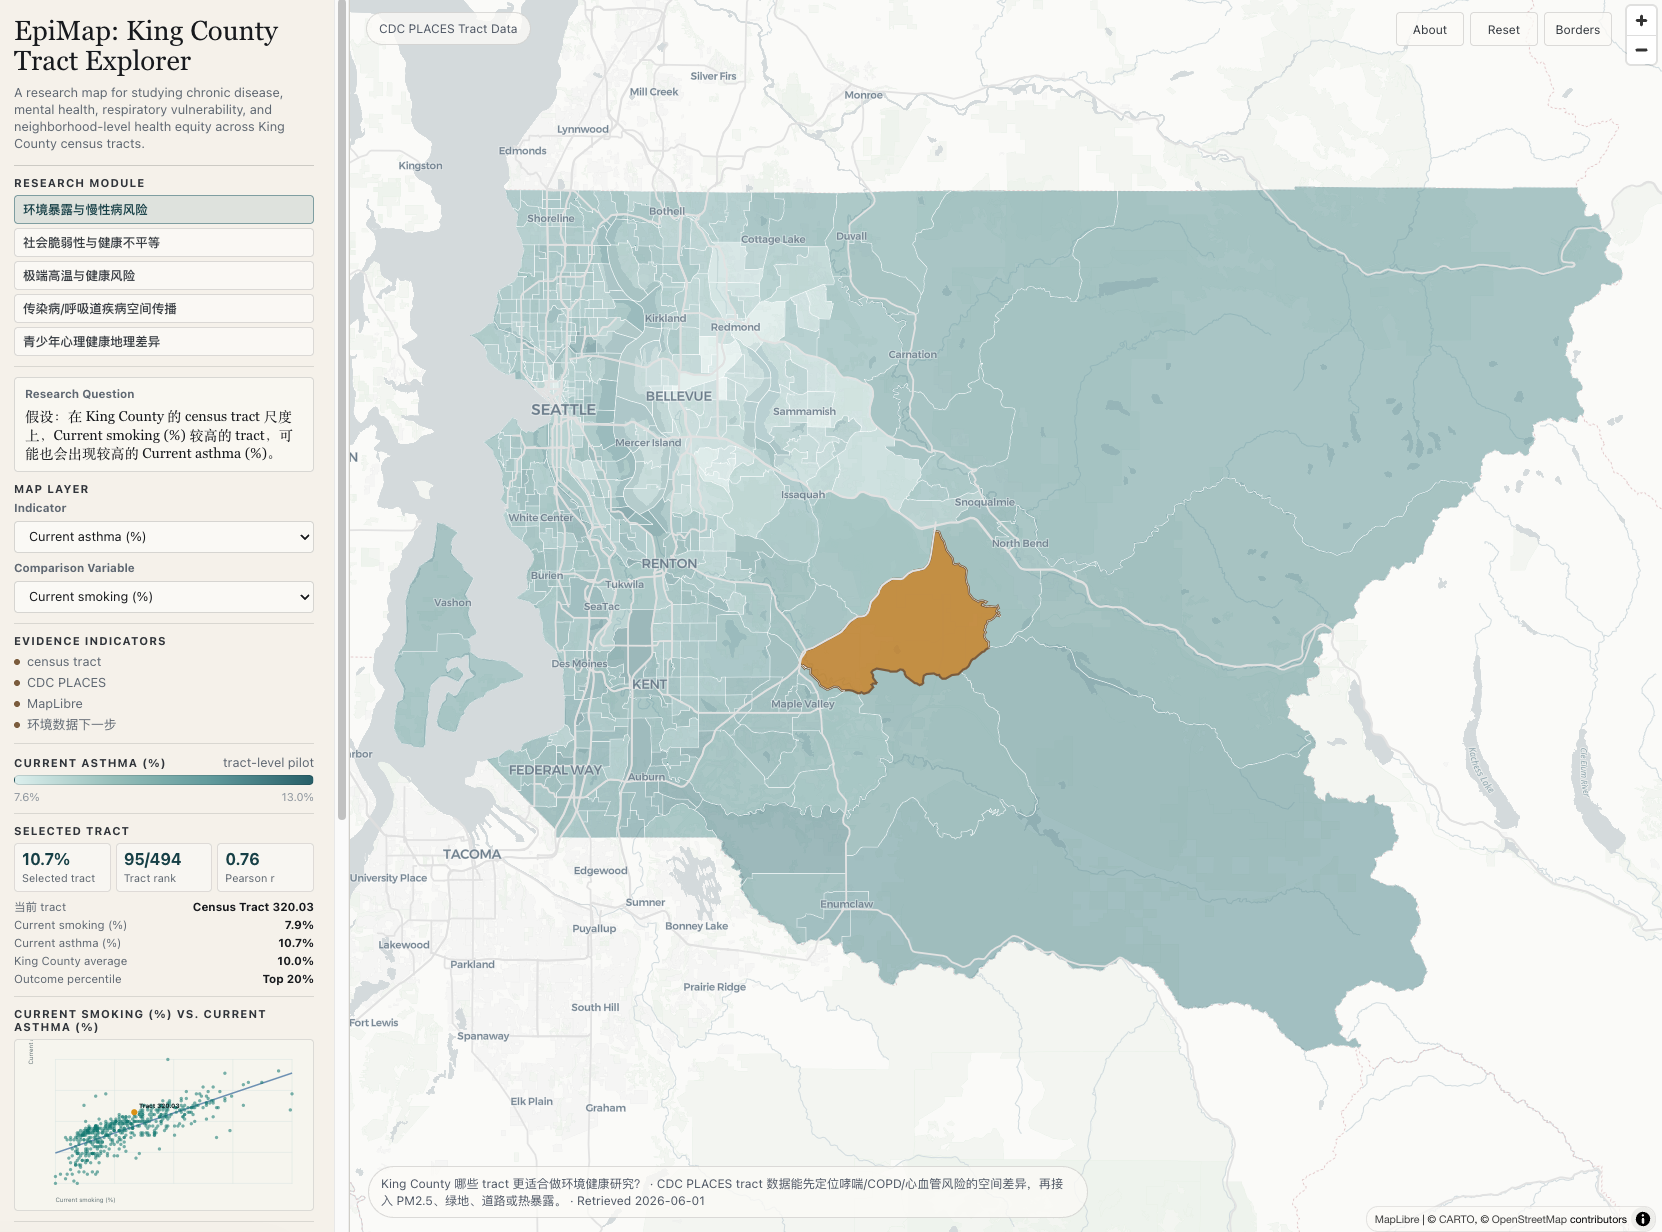
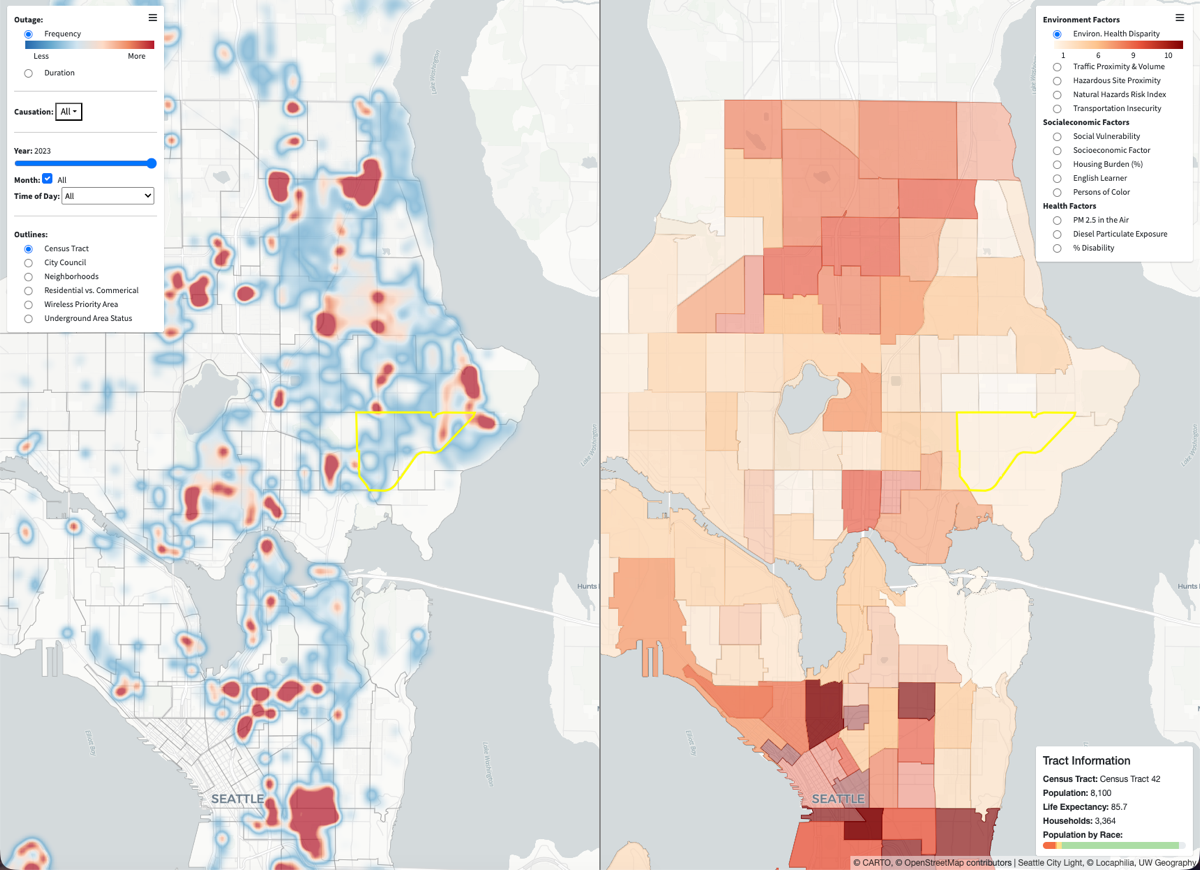
A research map for exploring chronic disease, mental health, respiratory vulnerability, and neighborhood-level health equity across King County census tracts.
2026
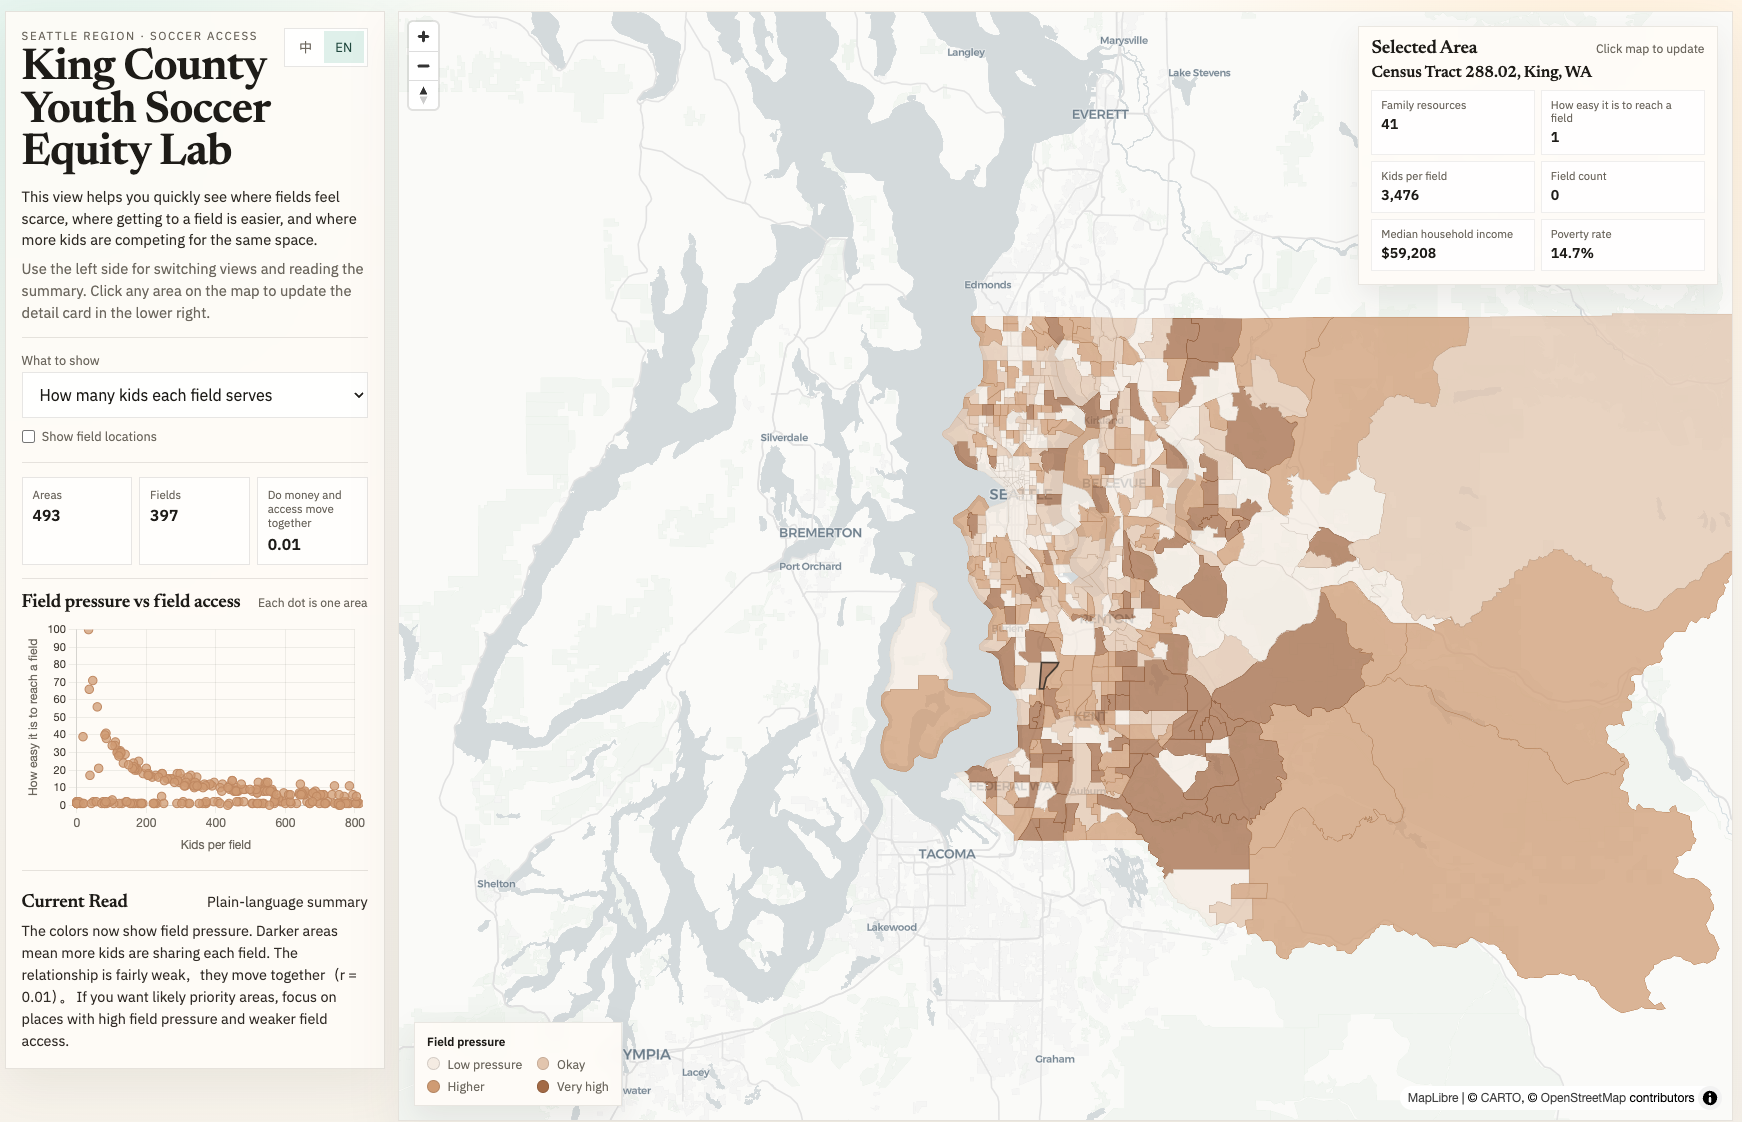
An interactive equity lab for comparing youth soccer field pressure, access, and neighborhood conditions across King County census tracts.
2026
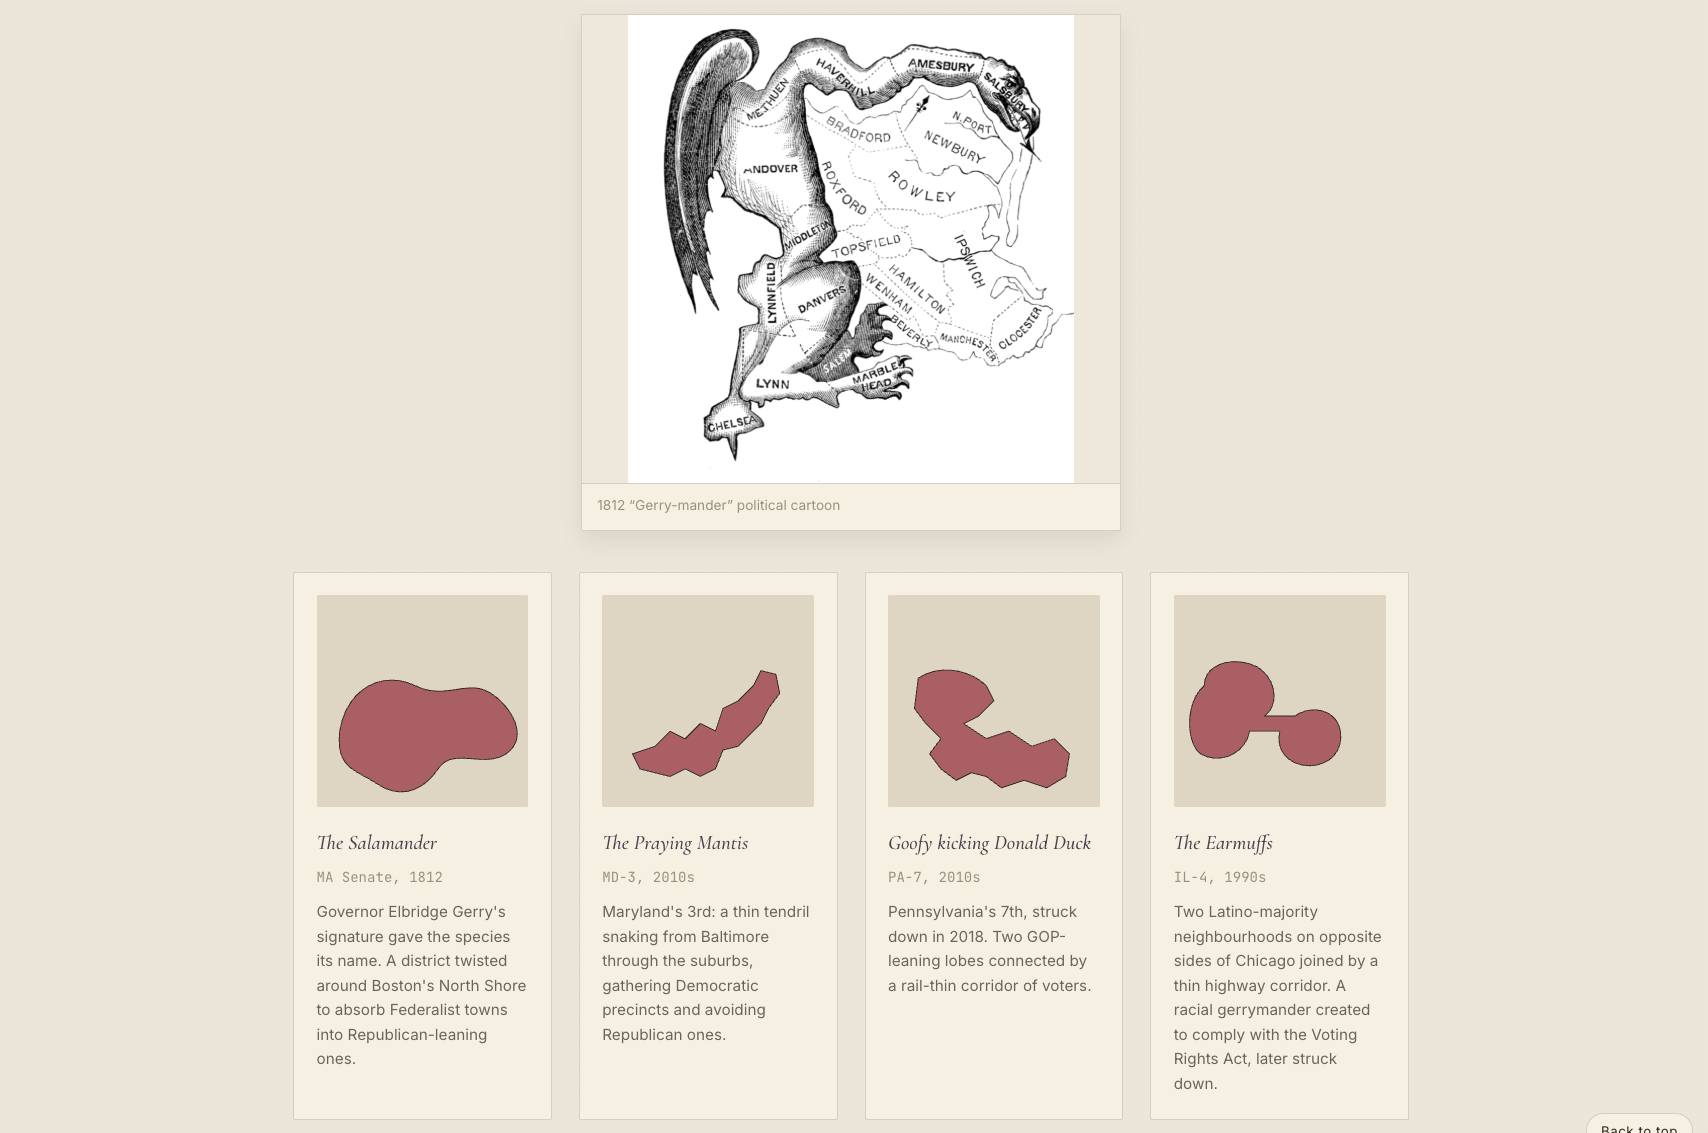
An interactive project on gerrymandering and political boundary-making, showing how drawn lines can bind communities, representation, and power.
2026
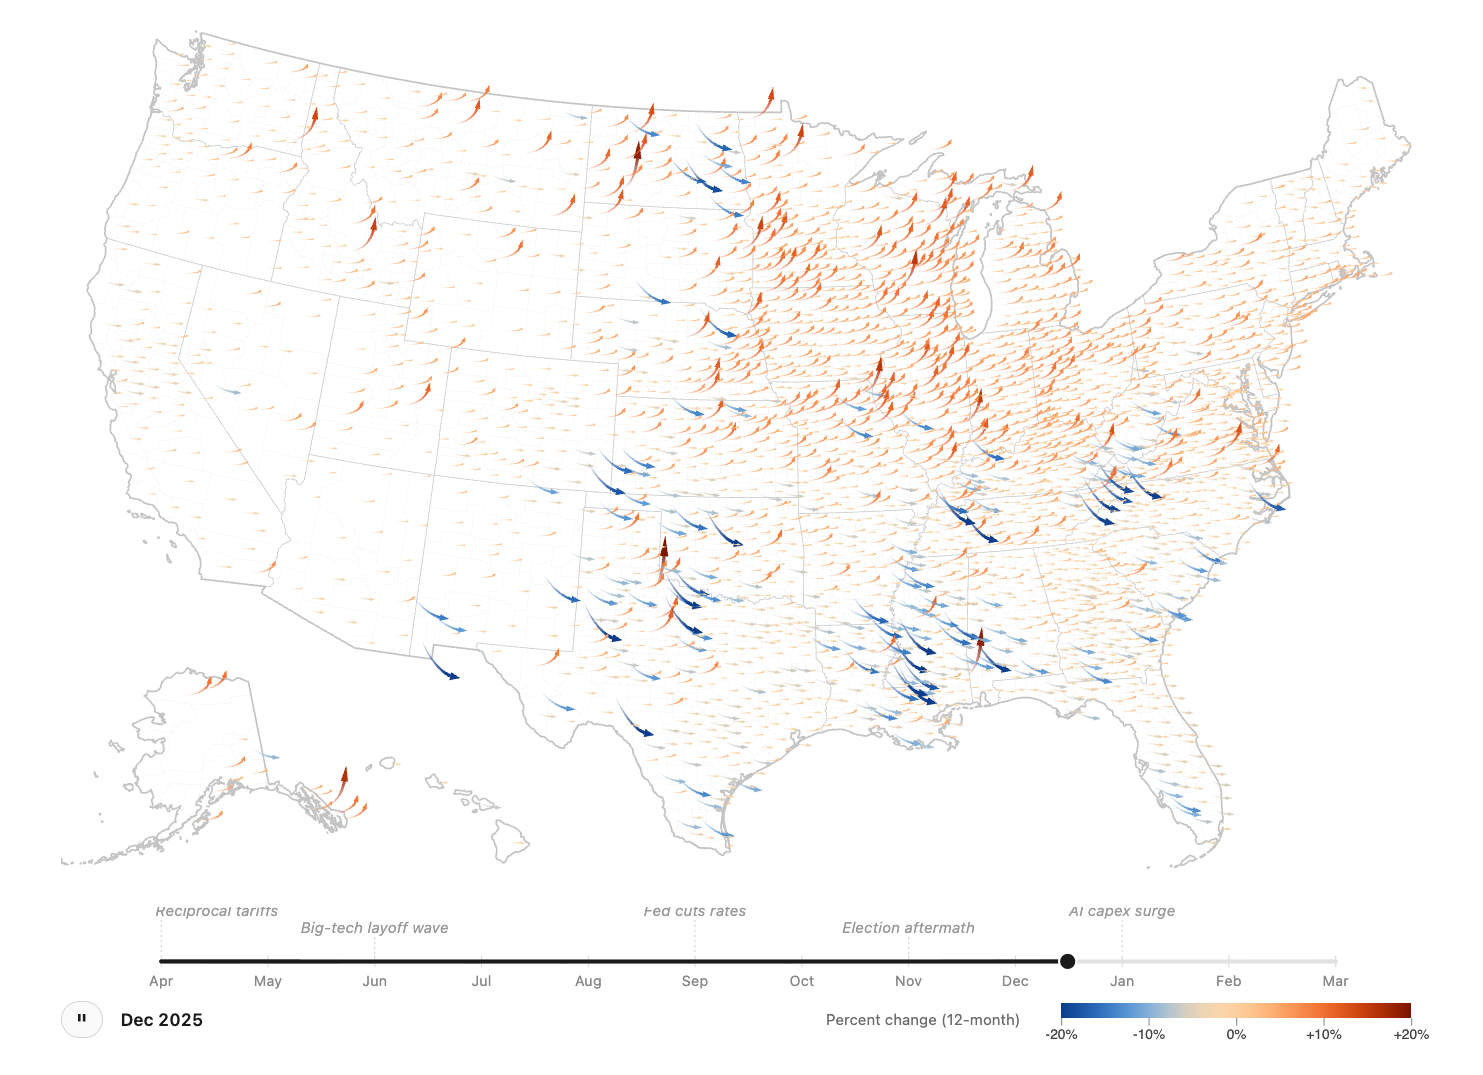
An arrow-based visualization of year-over-year change in residential property values across every U.S. county, animating the past twelve months of Zillow's ZHVI.
2026
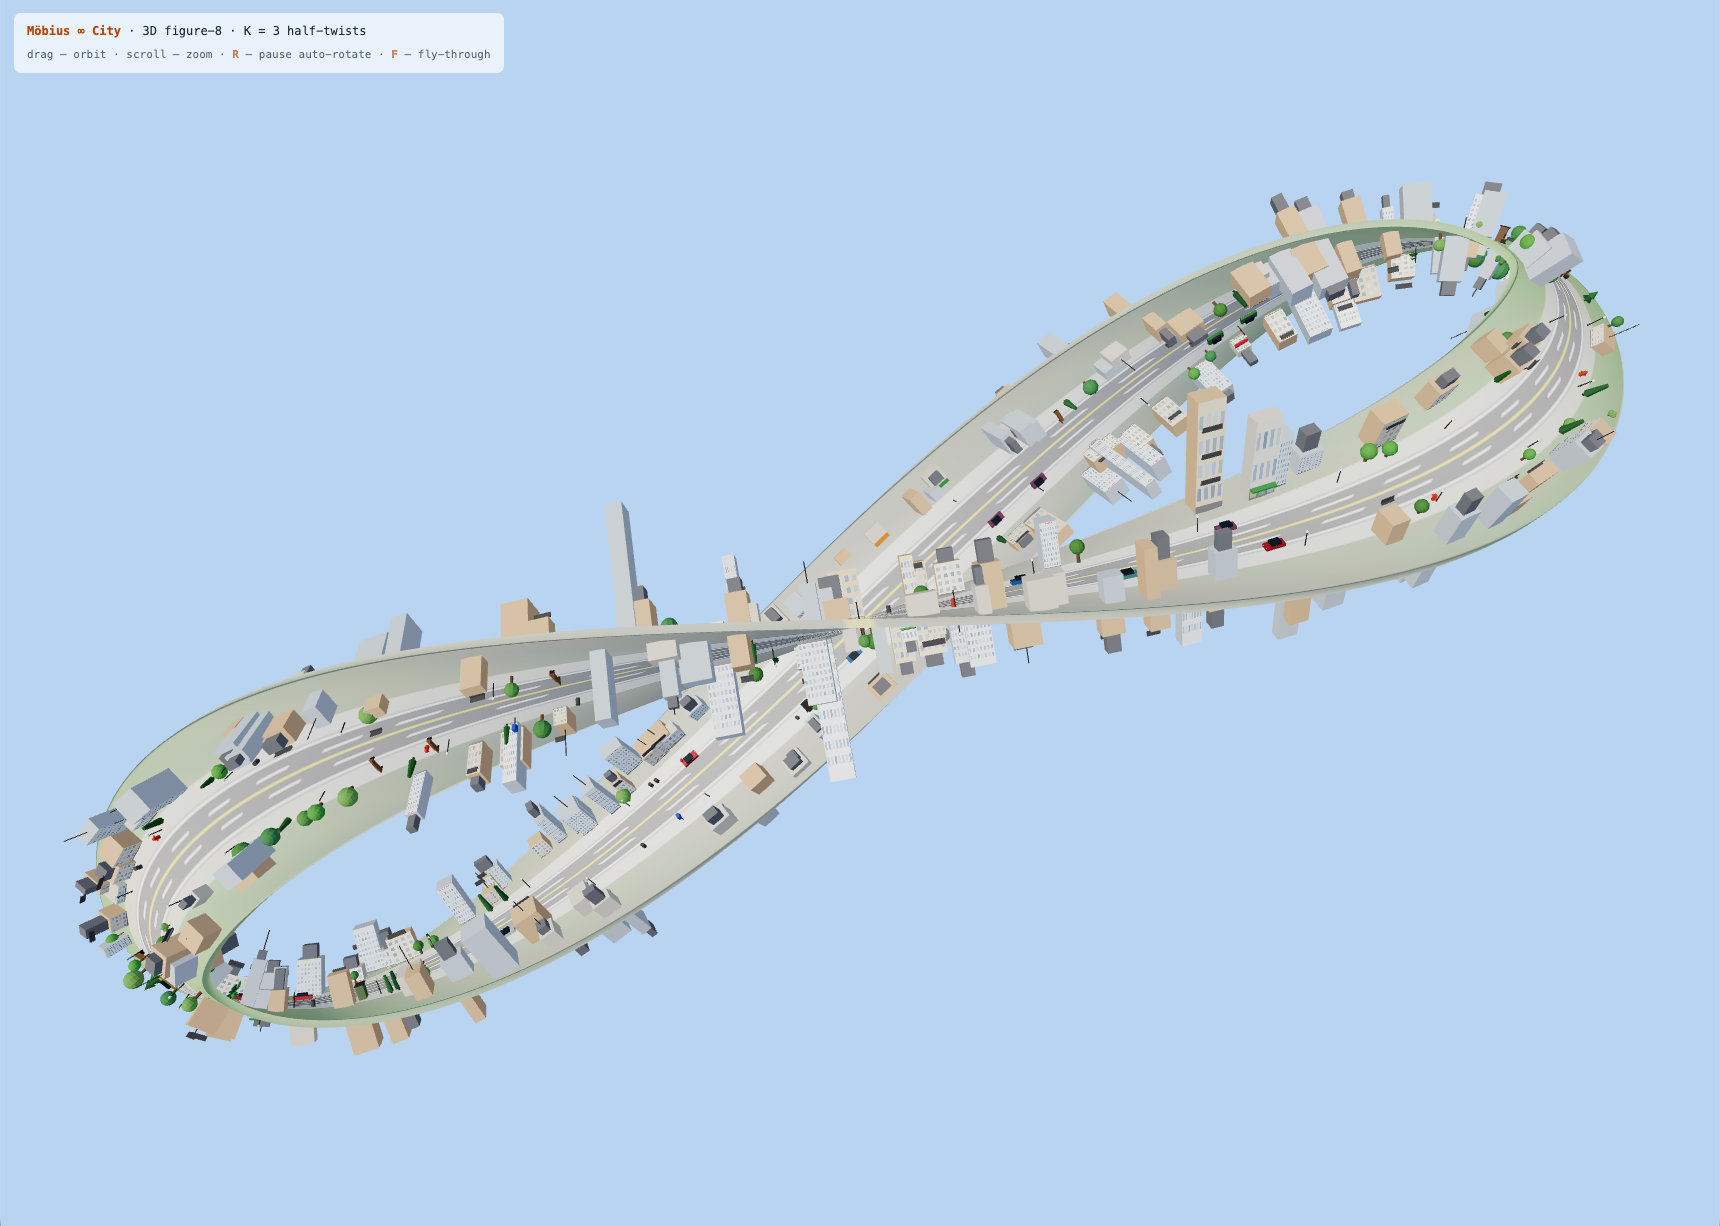
An interactive 3D city built on a Möbius strip with three half-twists, folding streets, blocks, and skylines into a continuous figure-8 topology you can fly through.
2025
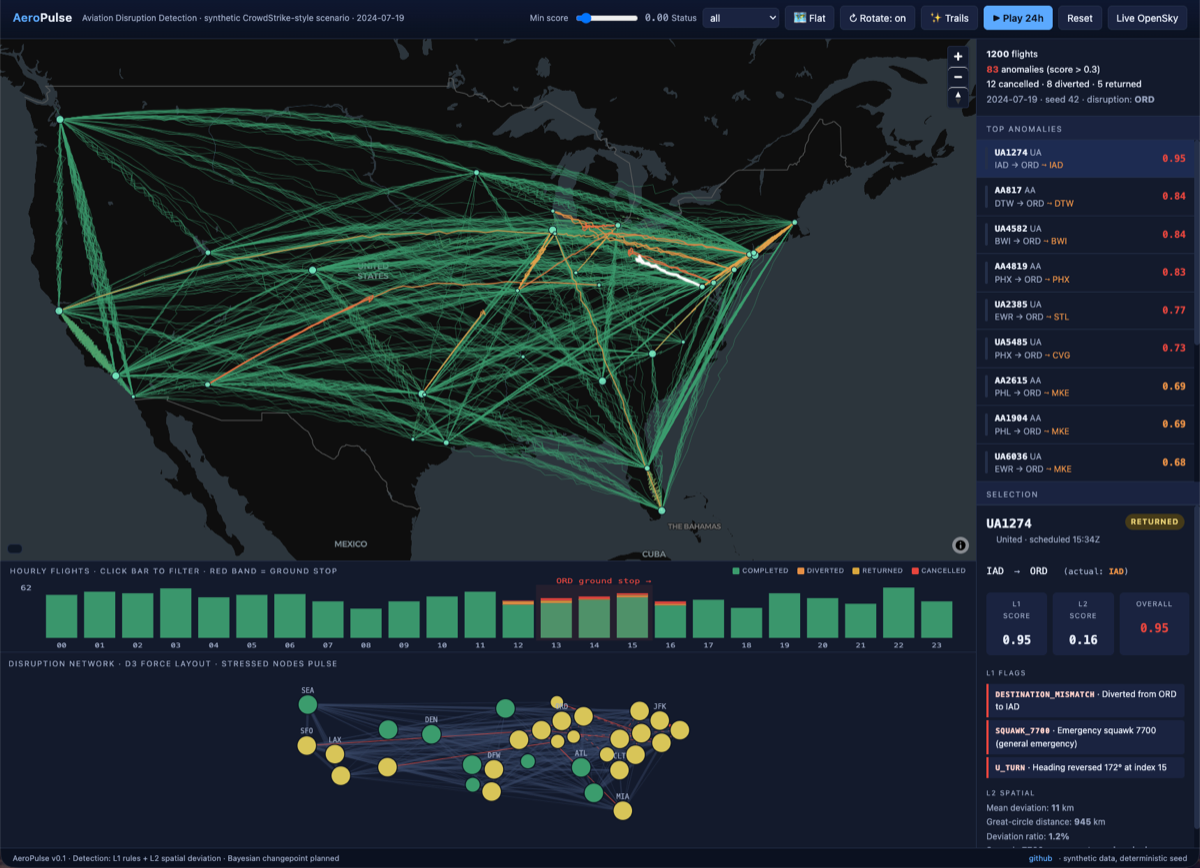
A live map of flight delays, cancellations, and diversions, surfacing how disruptions ripple across the global aviation network.
2025
An interactive cartography of Seattle's nighttime light landscape, reading the city through its illuminated infrastructures.
2025
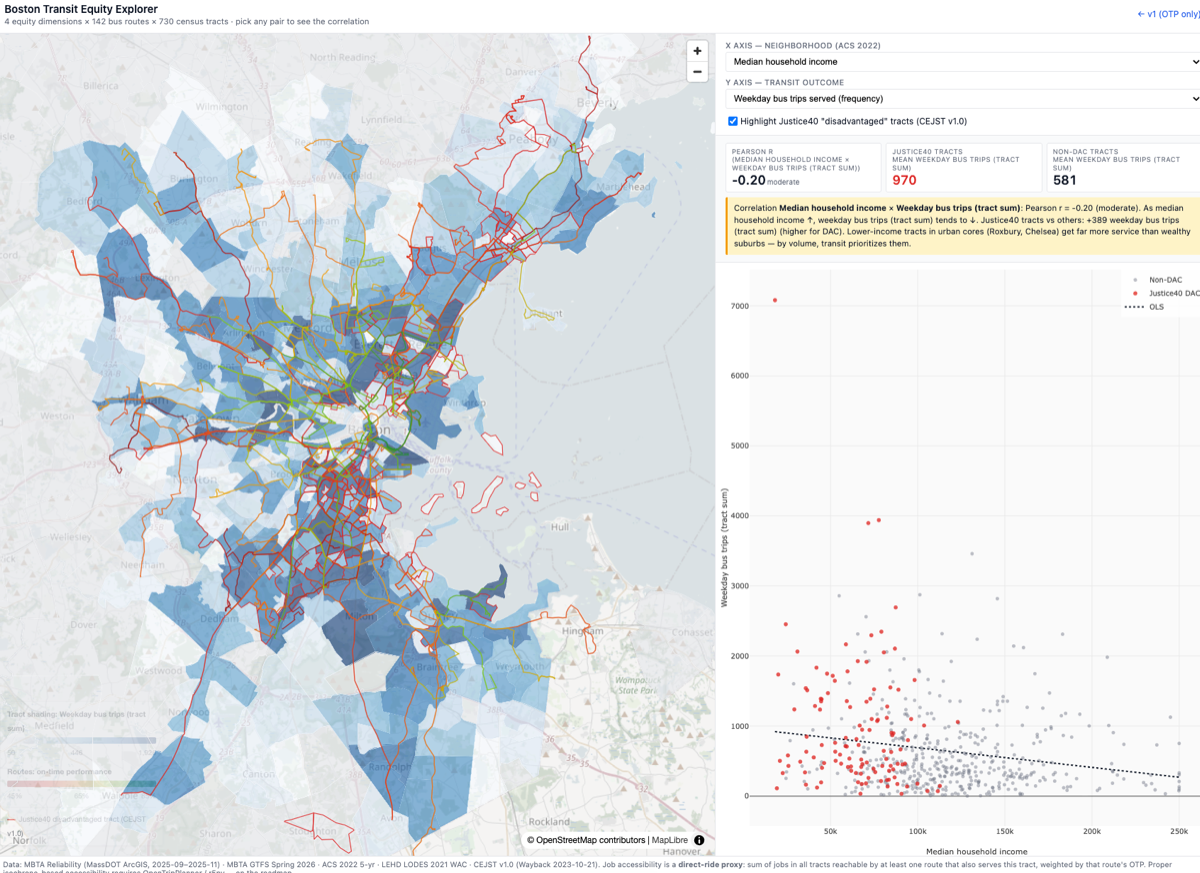
An equity-focused web atlas of Boston's MBTA system, examining how transit access intersects with race, income, and opportunity.
2025
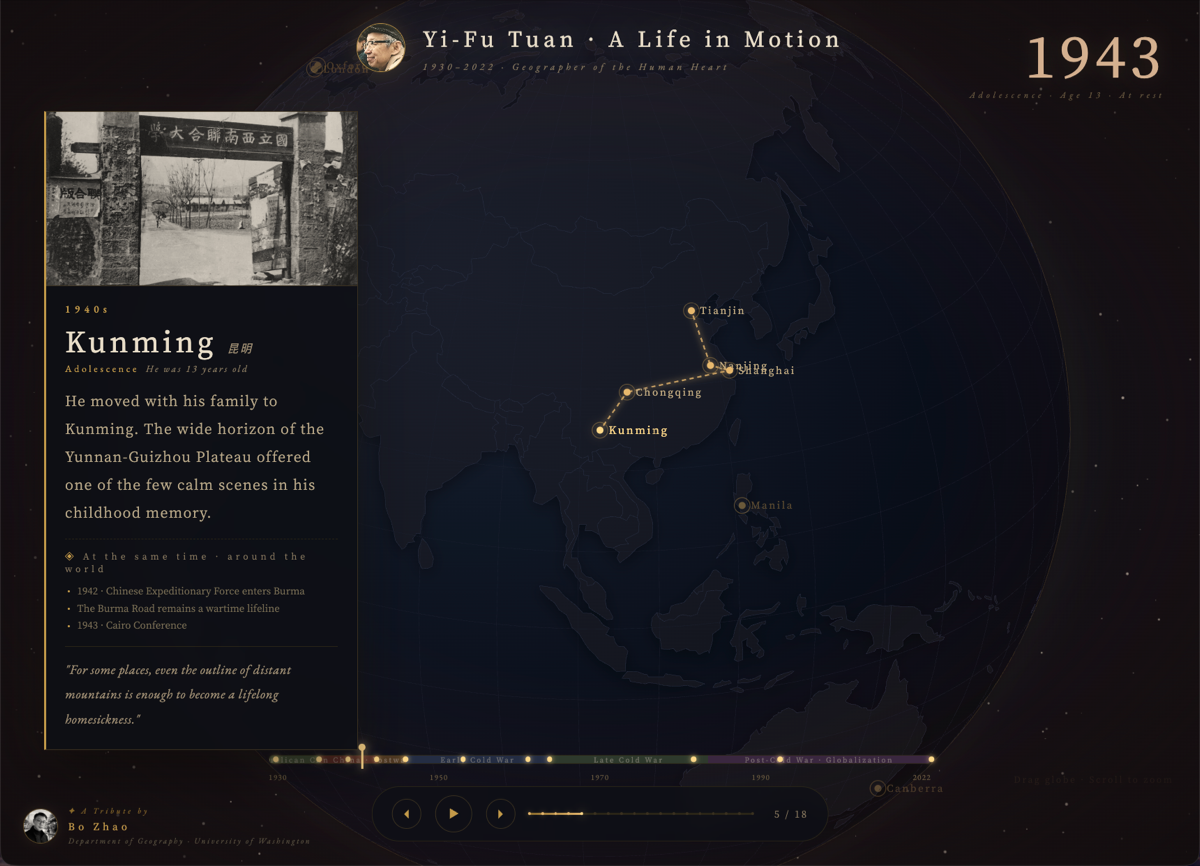
A geo-narrative tribute to Yi-Fu Tuan, tracing the places, ideas, and itineraries that shaped humanistic geography.
2024
A continuing inquiry into the geographies of LGBTQ+ life, charting how queer spaces emerge, persist, and disappear across time.
2023
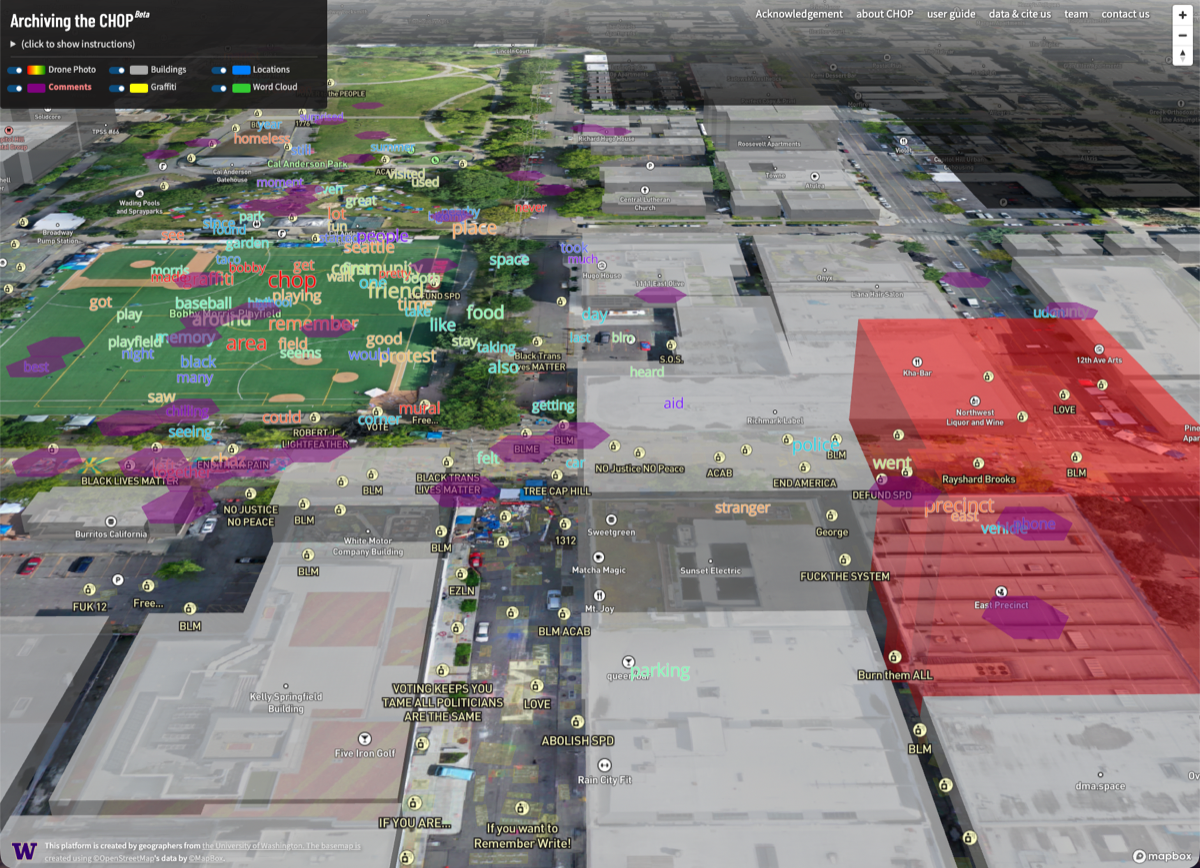
Critical and creative (un)mapping of the 2020 CHOP, weaving archival materials and oral histories into a layered geo-narrative of the protest space.
With D. Koopman, J.-K. Jung, H. Sun, & C. Anderson
2022
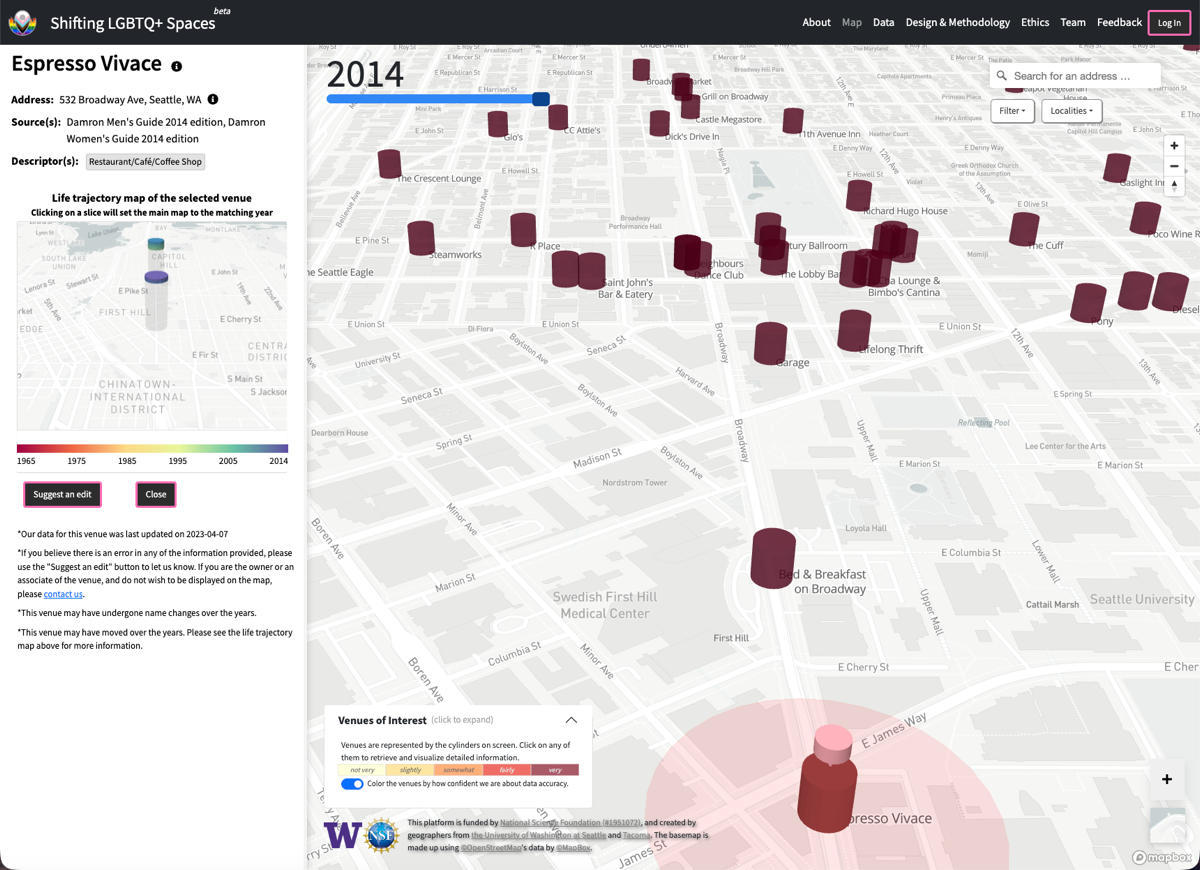
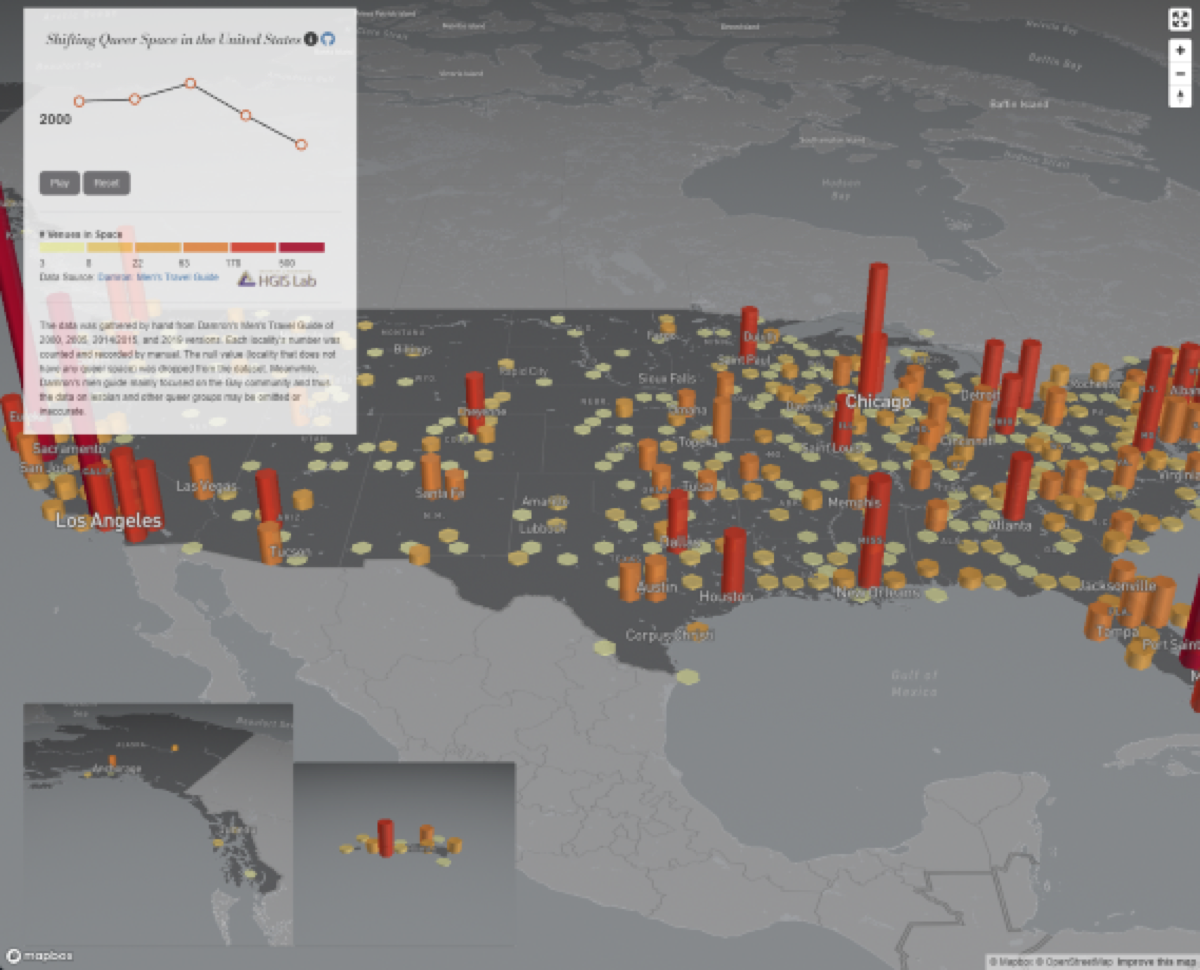
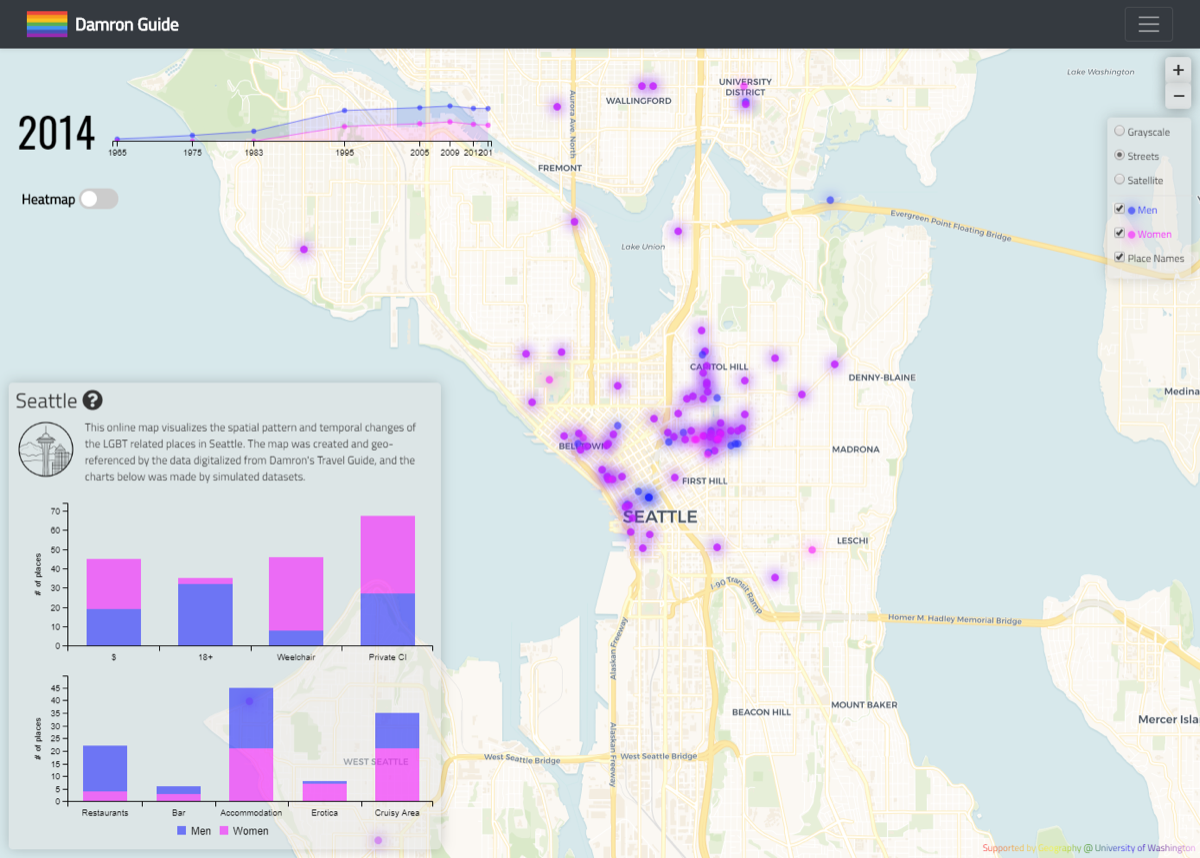
A web map of Damron Men's Travel Guide venues over two decades, charting the shifting geography of queer life across the United States.
With Q. Zhang, Y. Xia, J. Huang, & L. Peng
2021
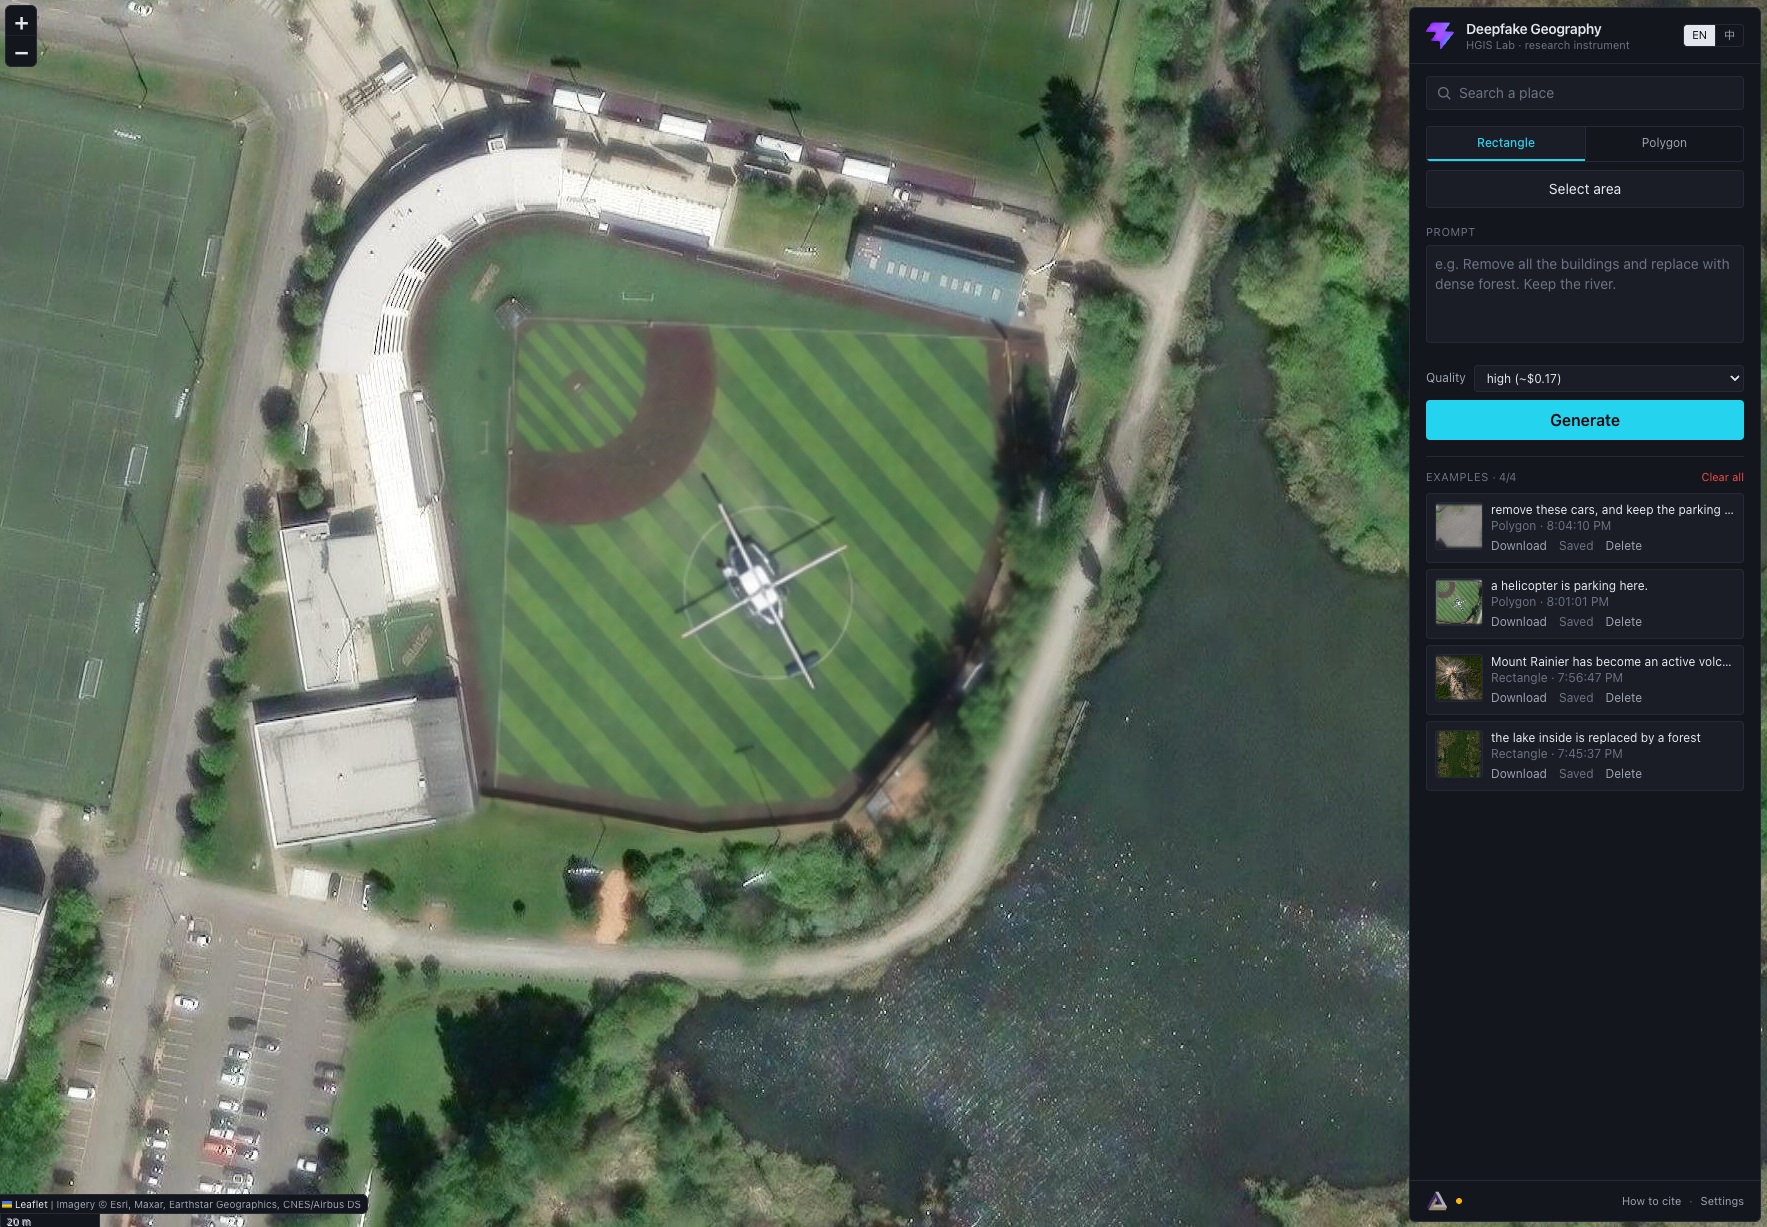
A public scholarship project on AI-fabricated satellite imagery and the emerging challenges deepfakes pose to spatial truth, trust, and geographic knowledge.
2020
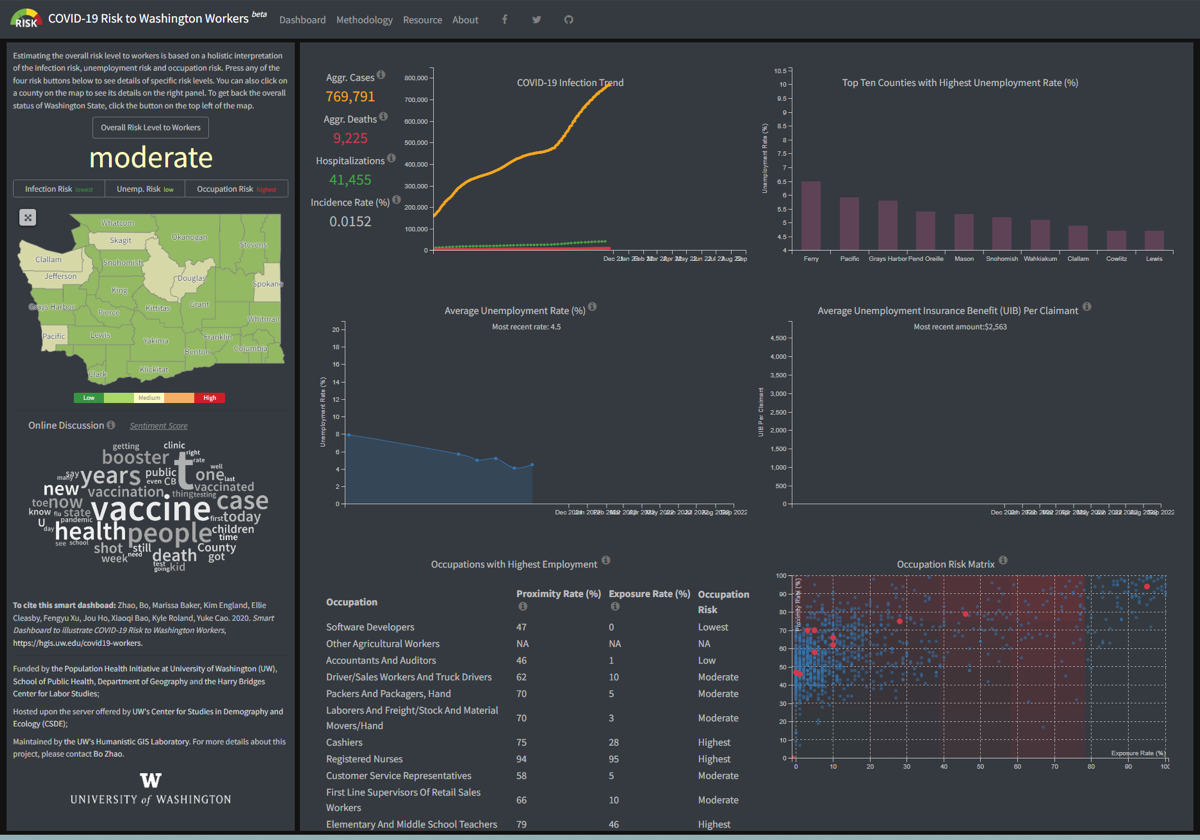
A smart dashboard characterizing occupational risk to Washington workers during the COVID-19 economic recovery.
With Marissa Baker & Kim England · UW Population Health Initiative
2020
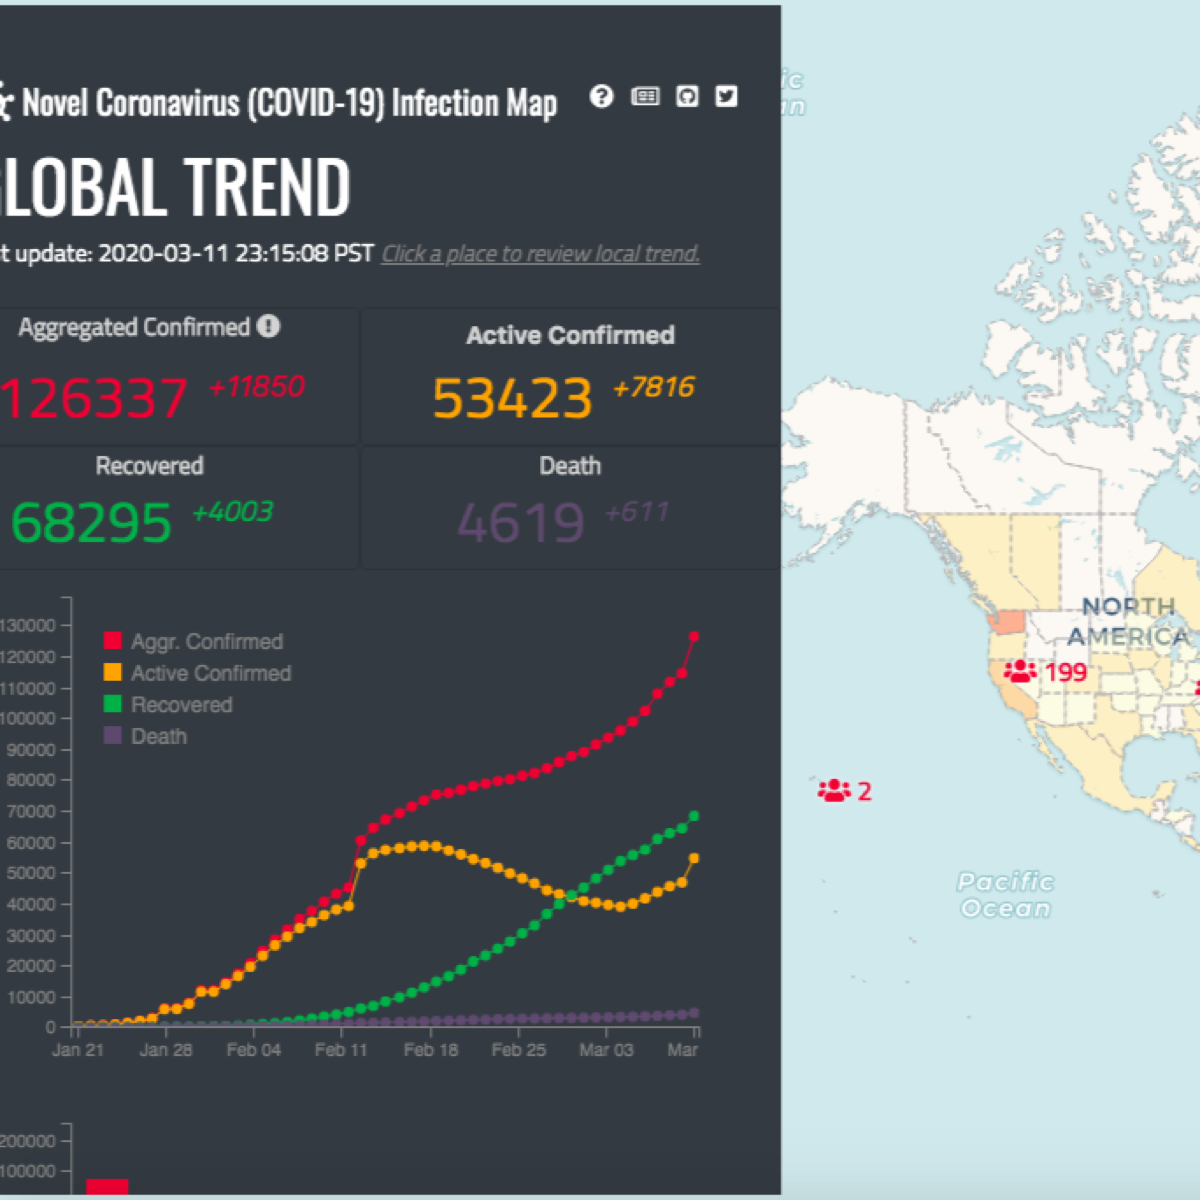
One of the earliest live dashboards of the COVID-19 pandemic, built in February 2020 and reported by BBC, National Geographic, and Anadolu Agency.
With F. Xu, L. Kang, J. Ji, J. Ho, & S. Bao
2020
An interactive virtual tour of UW's School of Environmental and Forest Sciences, blending 3D scenes with on-the-ground photography.
2019
A Seattle case study from the Damron Men's Travel Guide: locating decades of LGBTQ+ venues to recover a long-silenced urban history.
2018
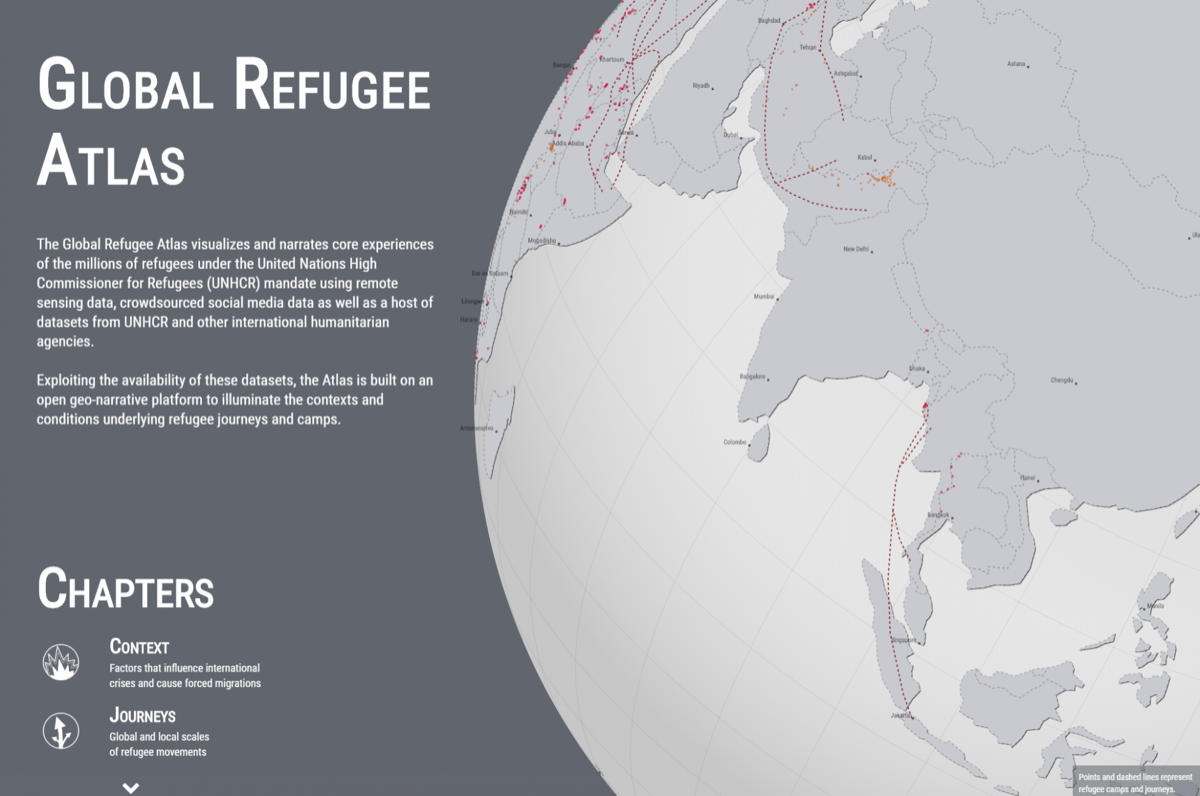
A National Geographic—funded atlas tracing global refugee flows and the geographies of displacement.
With Jamon Van Den Hoek & Jennifer Alix-Garcia · National Geographic NGS-51699S-18
2018
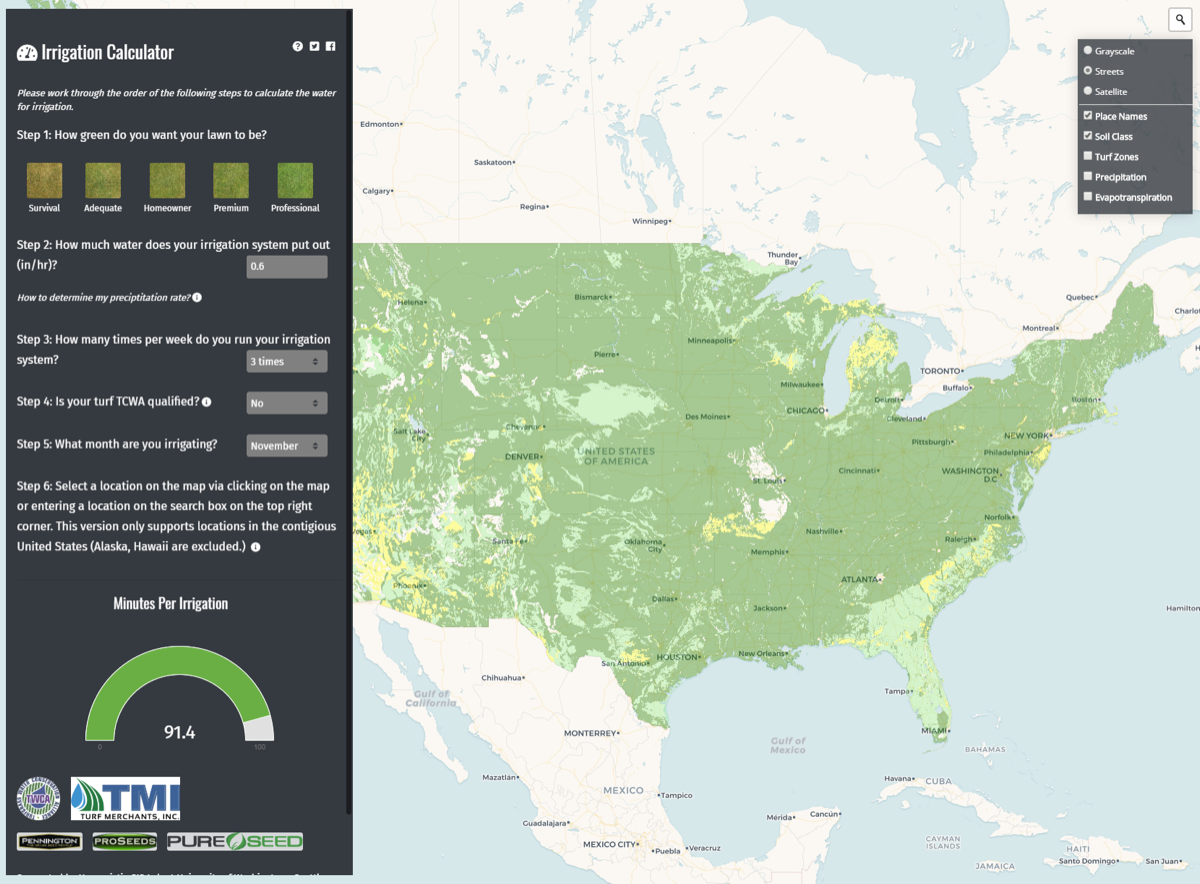
A geovisual analytic platform for the Turfgrass Water Conservation Alliance, helping turfgrass producers reason about regional water savings.
Funded by Turfgrass Water Conservation Alliance
2018
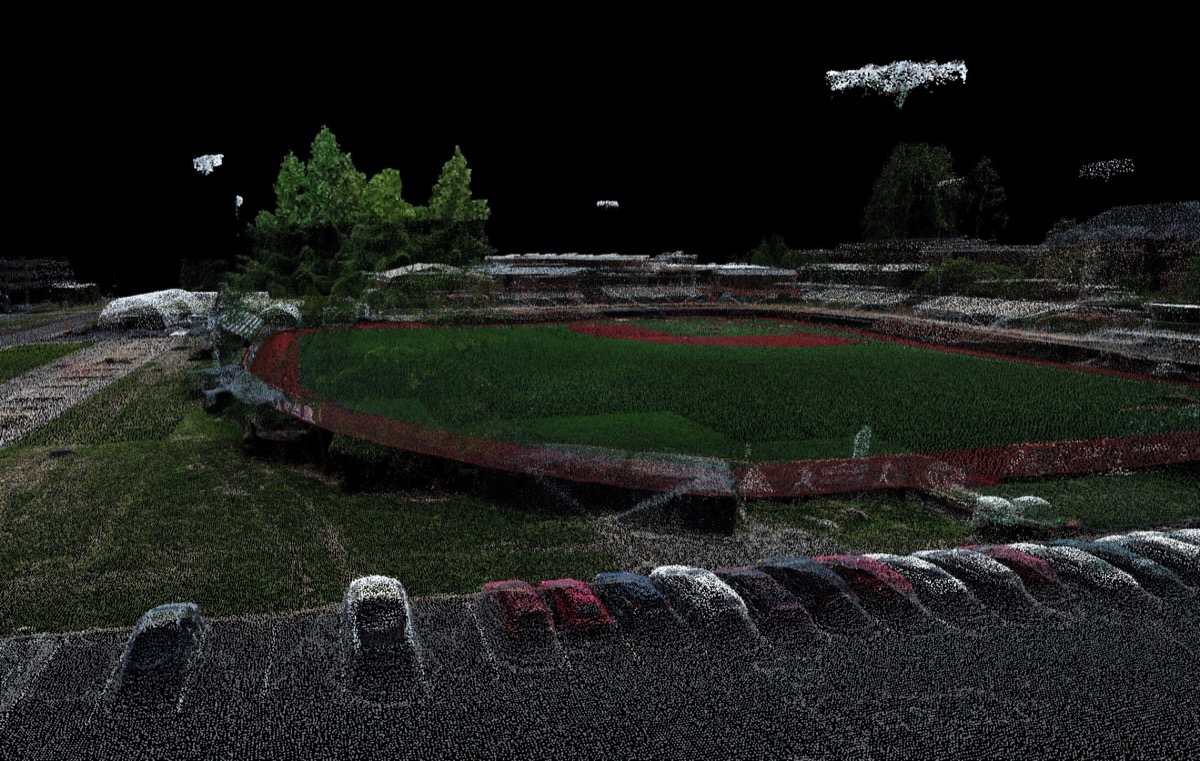
A WebGL point cloud viewer for sharing high-resolution lidar scans on the open web.
2018
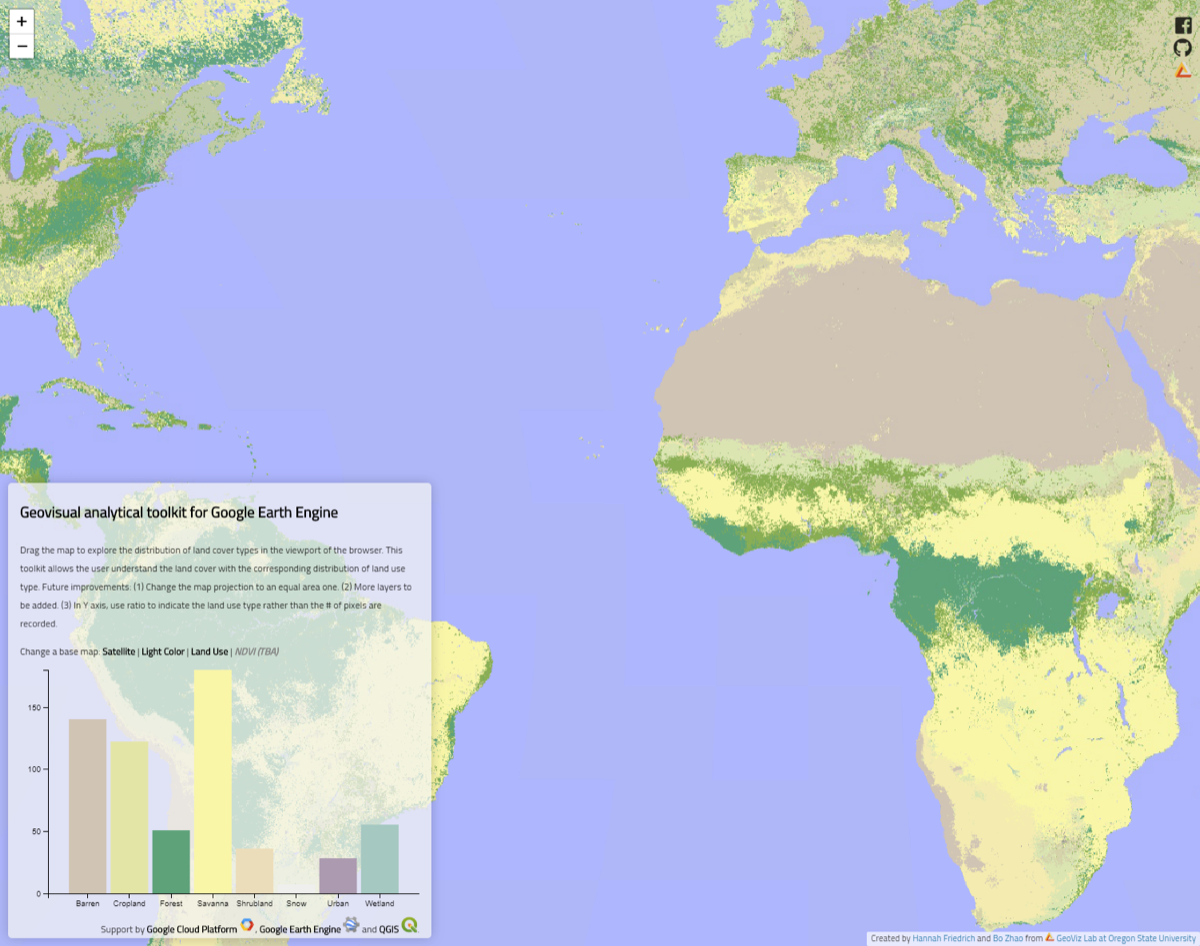
A web platform for exploring planetary-scale Google Earth Engine datasets through interactive geovisual analytics.
Supported by Google Cloud Platform · with H. Friedrich
2018
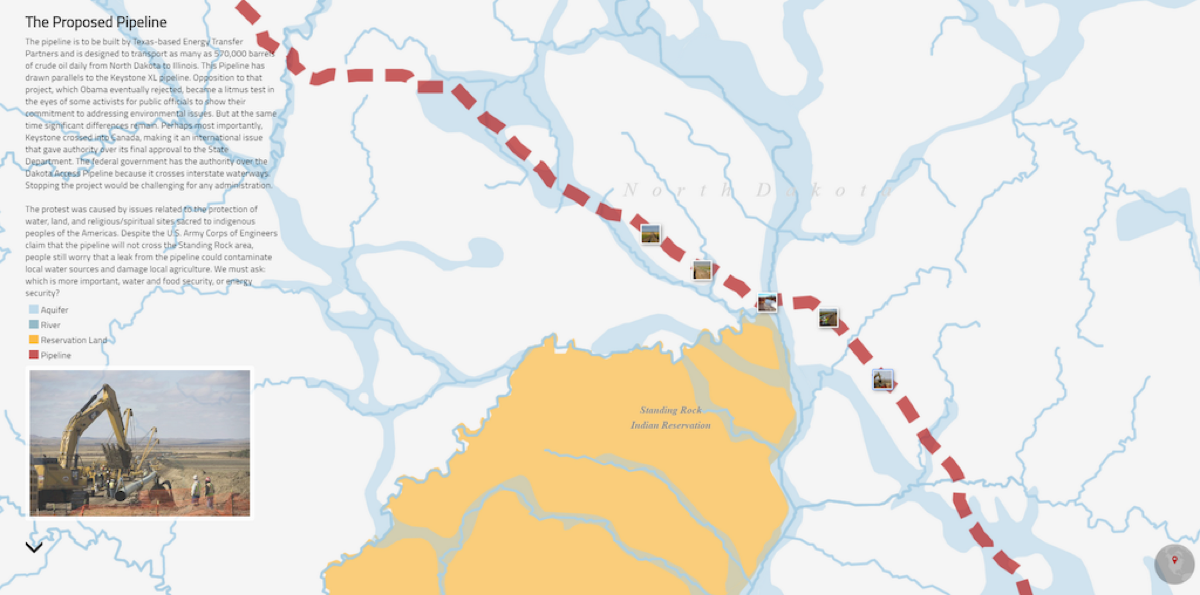
An epistemological experiment in geospatial big data during the post-truth era, supporting the land claims of Sioux tribes through critical mapping.
With Yuanyuan Tian, Shaozeng Zhang, & Shenliang Chen
2017
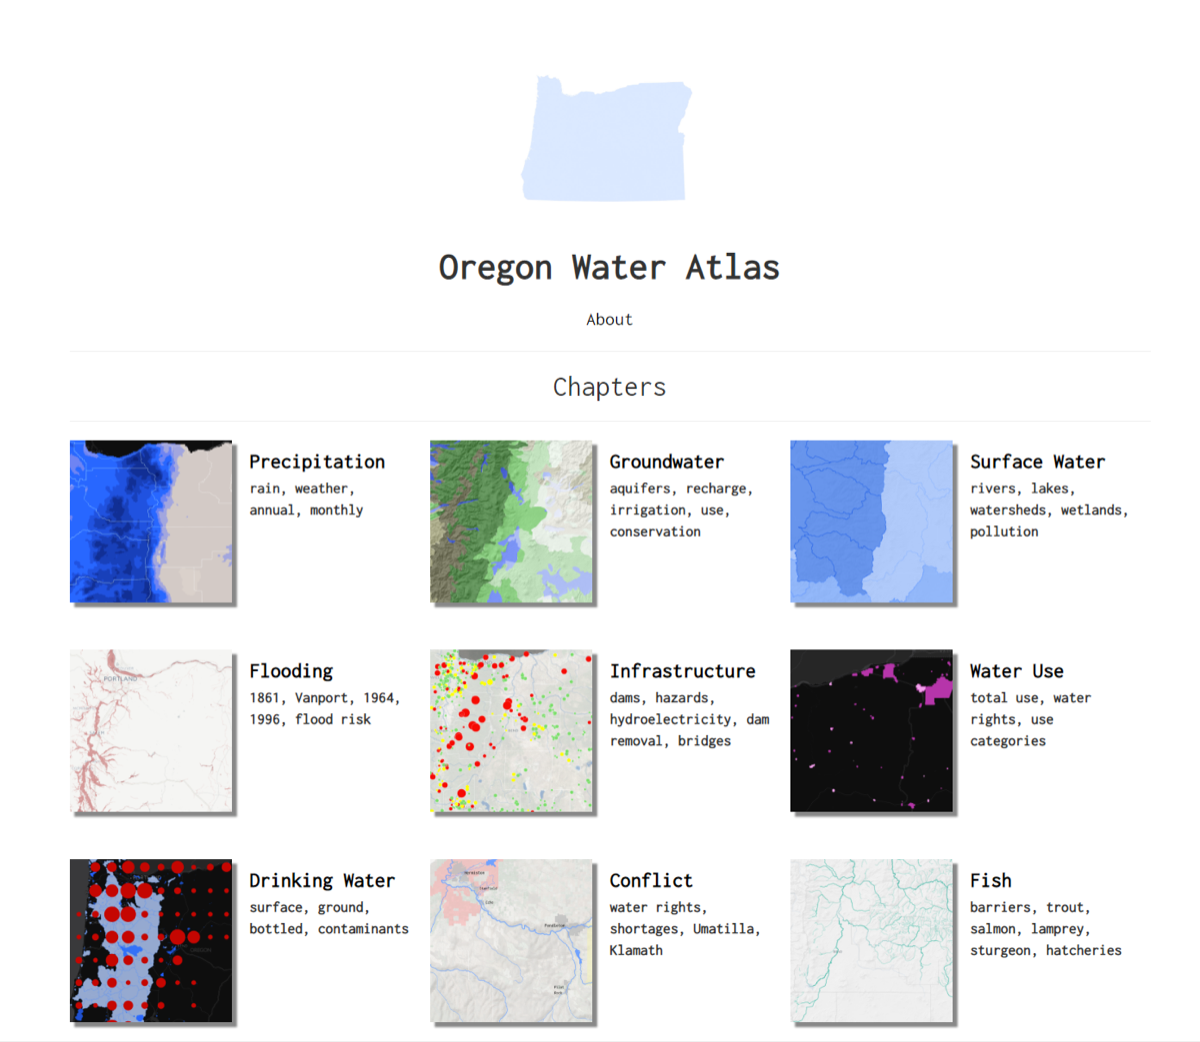
A digital collection and visualization of Oregon's water resources — winner of the Student Environment Challenge (Oregon Chapter, AWMA).
2017
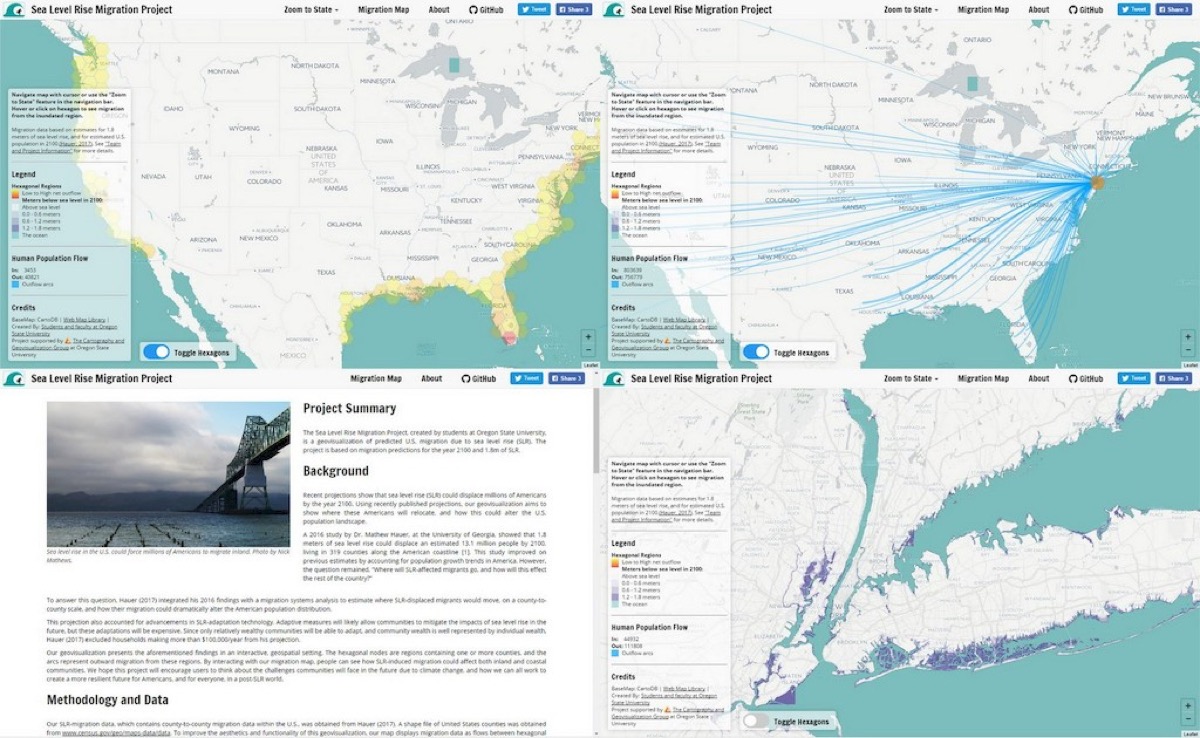
An award-winning visualization of how sea level rise reshapes coastal migration patterns in the United States. Grand Prize, Ecological Visualization Contest.
NSF-DBI-1062566
2017
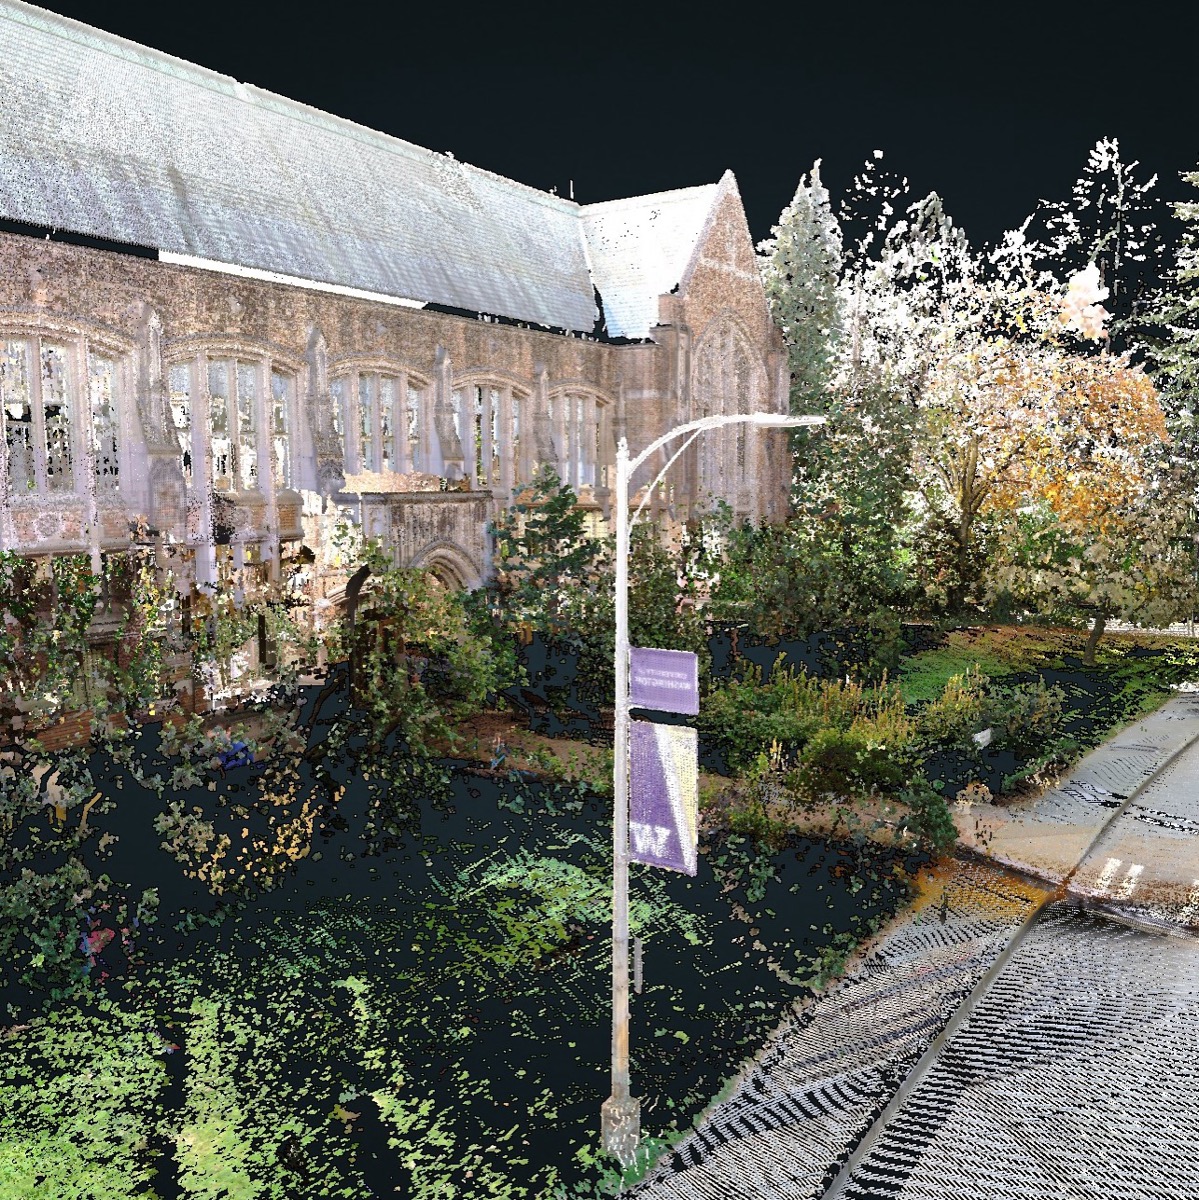
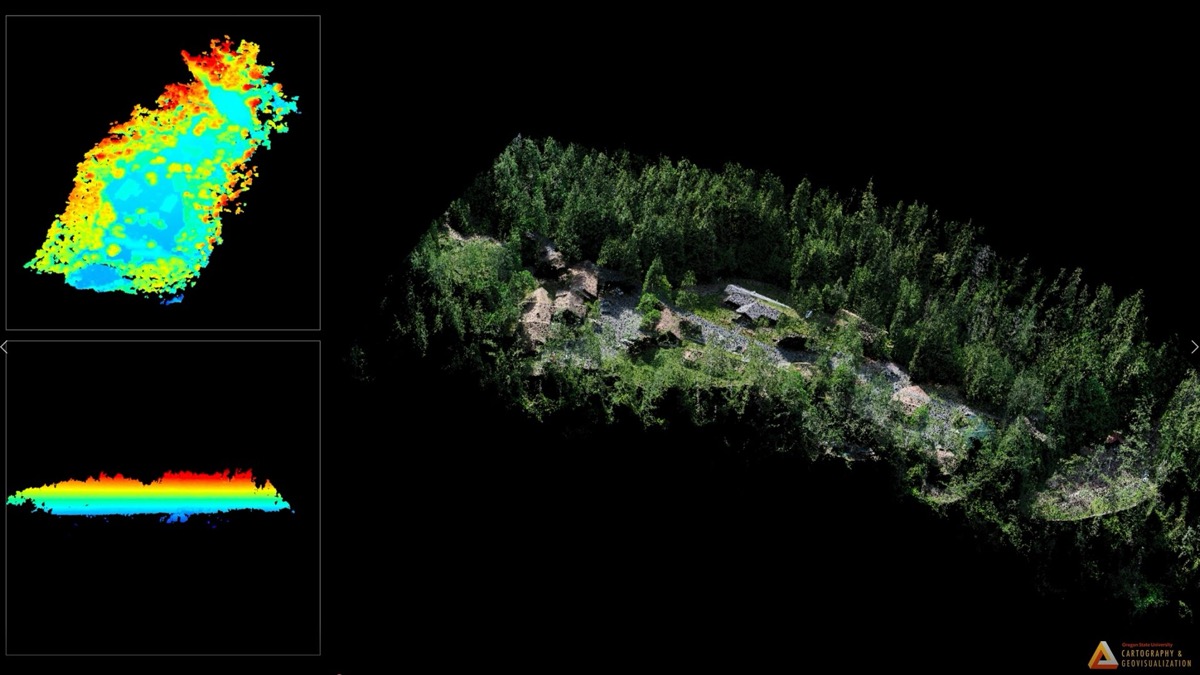
A web point-cloud visualization of the H.J. Andrews Experimental Forest headquarters area, built from terrestrial lidar.

2016
A lightweight JavaScript library for telling place-based stories on web maps. Used in courses and community projects.